Verification of the Tsunami Disaster Map of Great East Japan earthquake
a quick excursion to Onagawa and Ishinomaki
The 2011 East Japan Earthquake Bulletin of the Tohoku Geographical Association
28 April, 2011
Takashi Abe (Japan Women’s University), Email: geo-tak(a)fc.jwu.ac.jp
Takehiko Takano (Tohoku Gakuin University), Email: tktk(a)izcc.tohoku-gakuin.ac.jp
Yuzuru Isoda (Tohoku University), Email: isoda(a)m.tohoku.ac.jp
The following report summarize the result of urgent checking investigation of “Maps of the Area hit by the Tsunami of 11 March 2022, Northeast Japan” (Tsunami Disaster Map hereafter) which “Tsunami Damage Mapping Team in the Association of Japanese Geographer” created. Their maps can be viewed from:
http://danso.env.nagoya-u.ac.jp/20110311/map/index_e.html
Investigation on the field took place on April 3rd (Onagawa and Ishinomaki) and April 4th (Sendai). Because of the transportation condition of damaged area, this had been a short-time investigation. The usefulness of the Tsunami Disaster Map, however, was verified.
The locations of photos in the following article can be viewed from the link below:
https://picasaweb.google.com/118384443560213581159/MiyagiReport#
Onagawa area
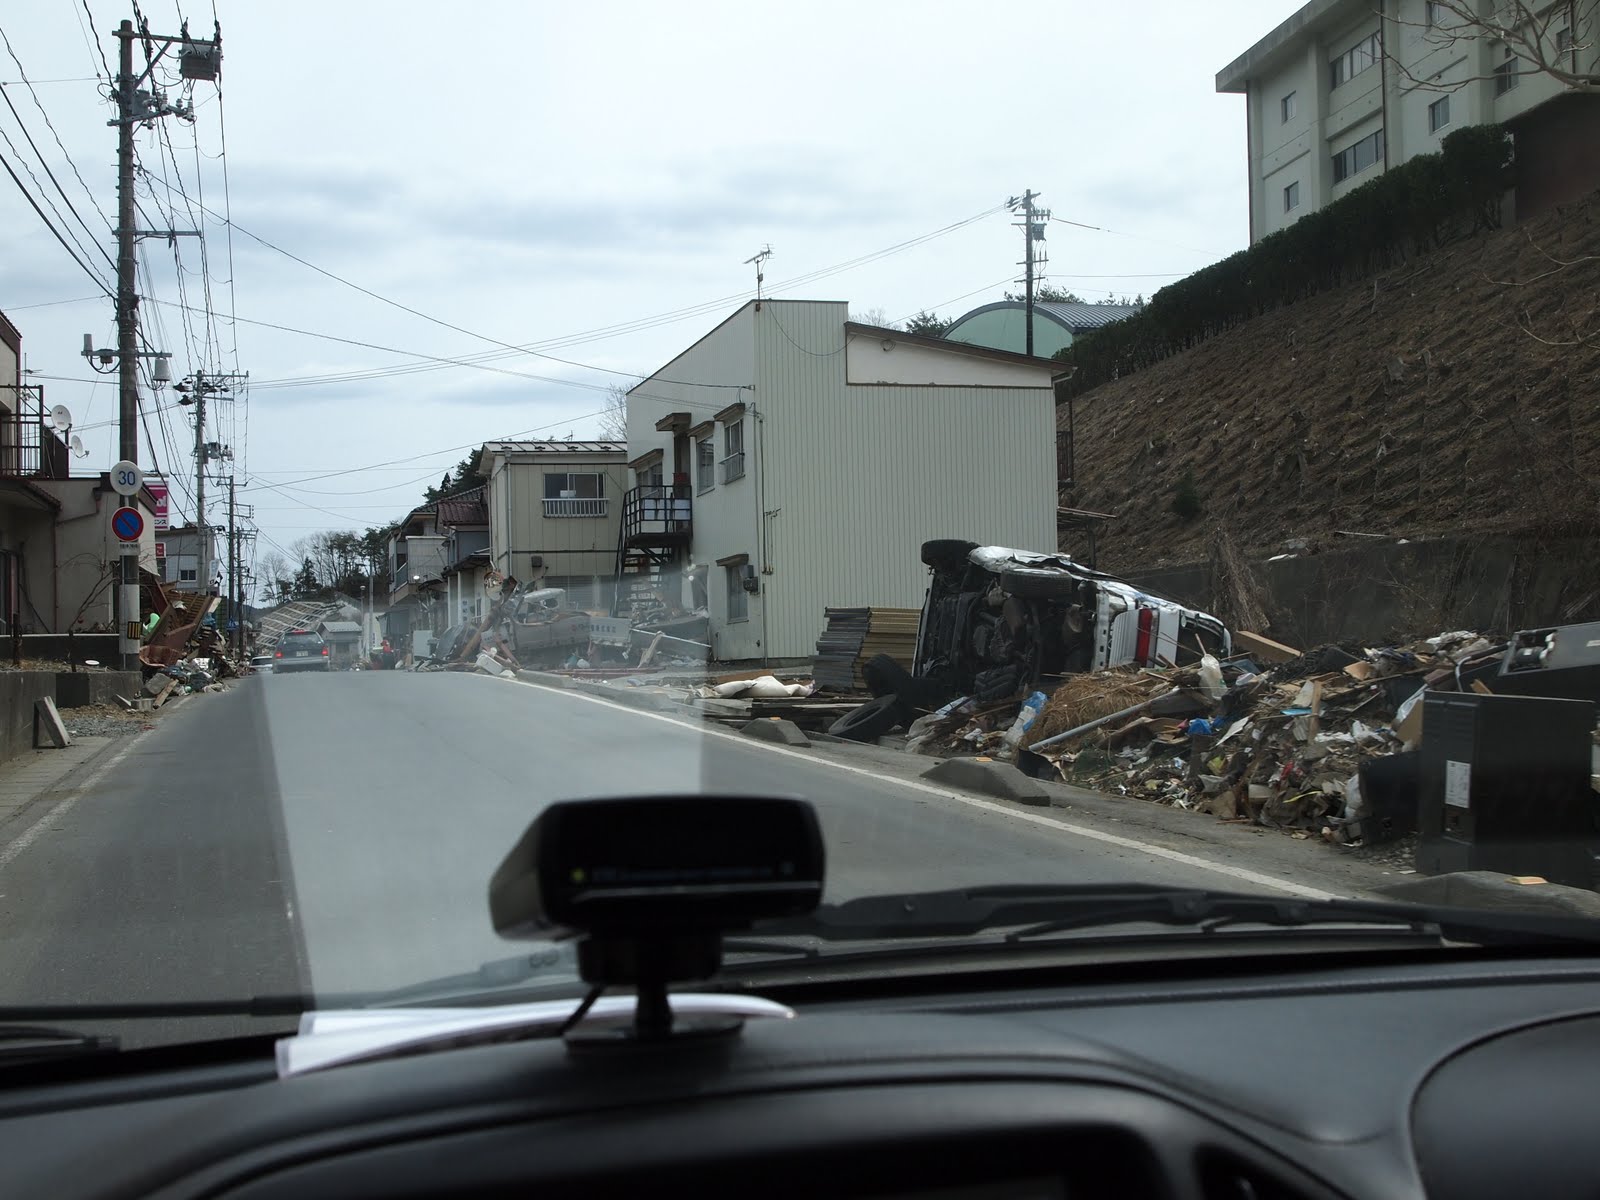
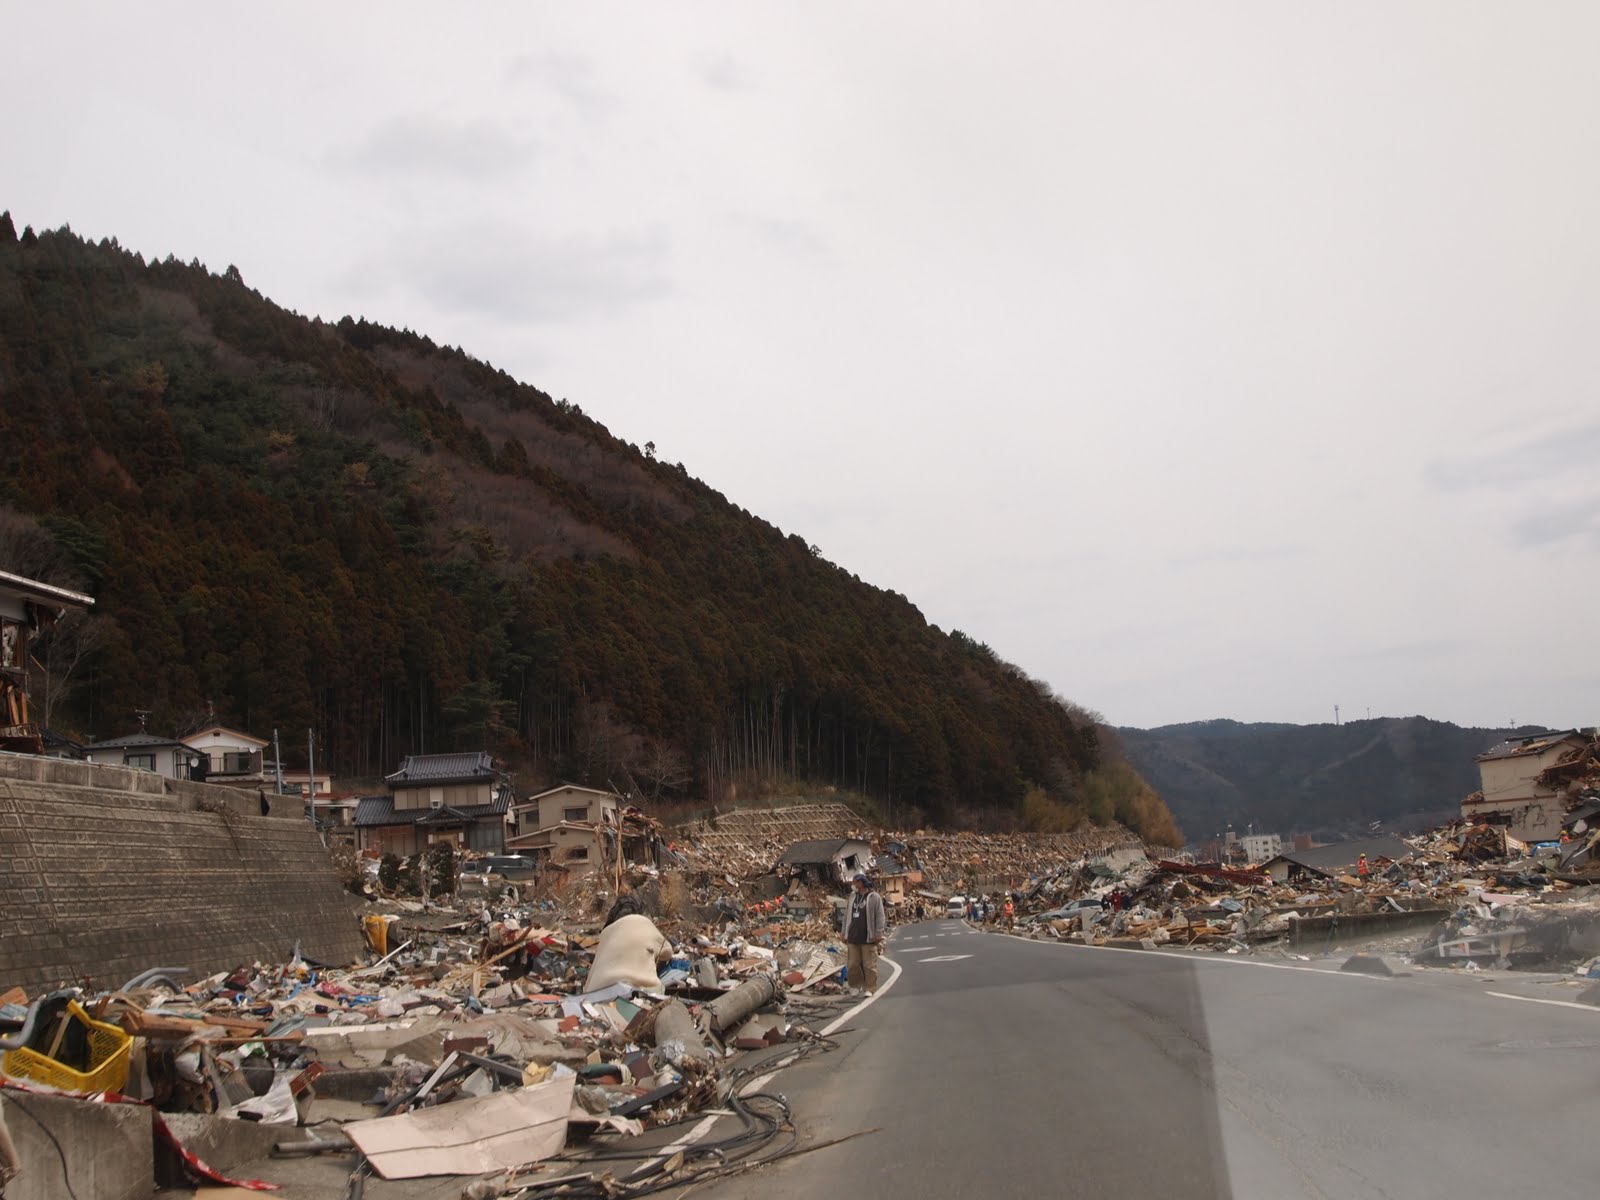
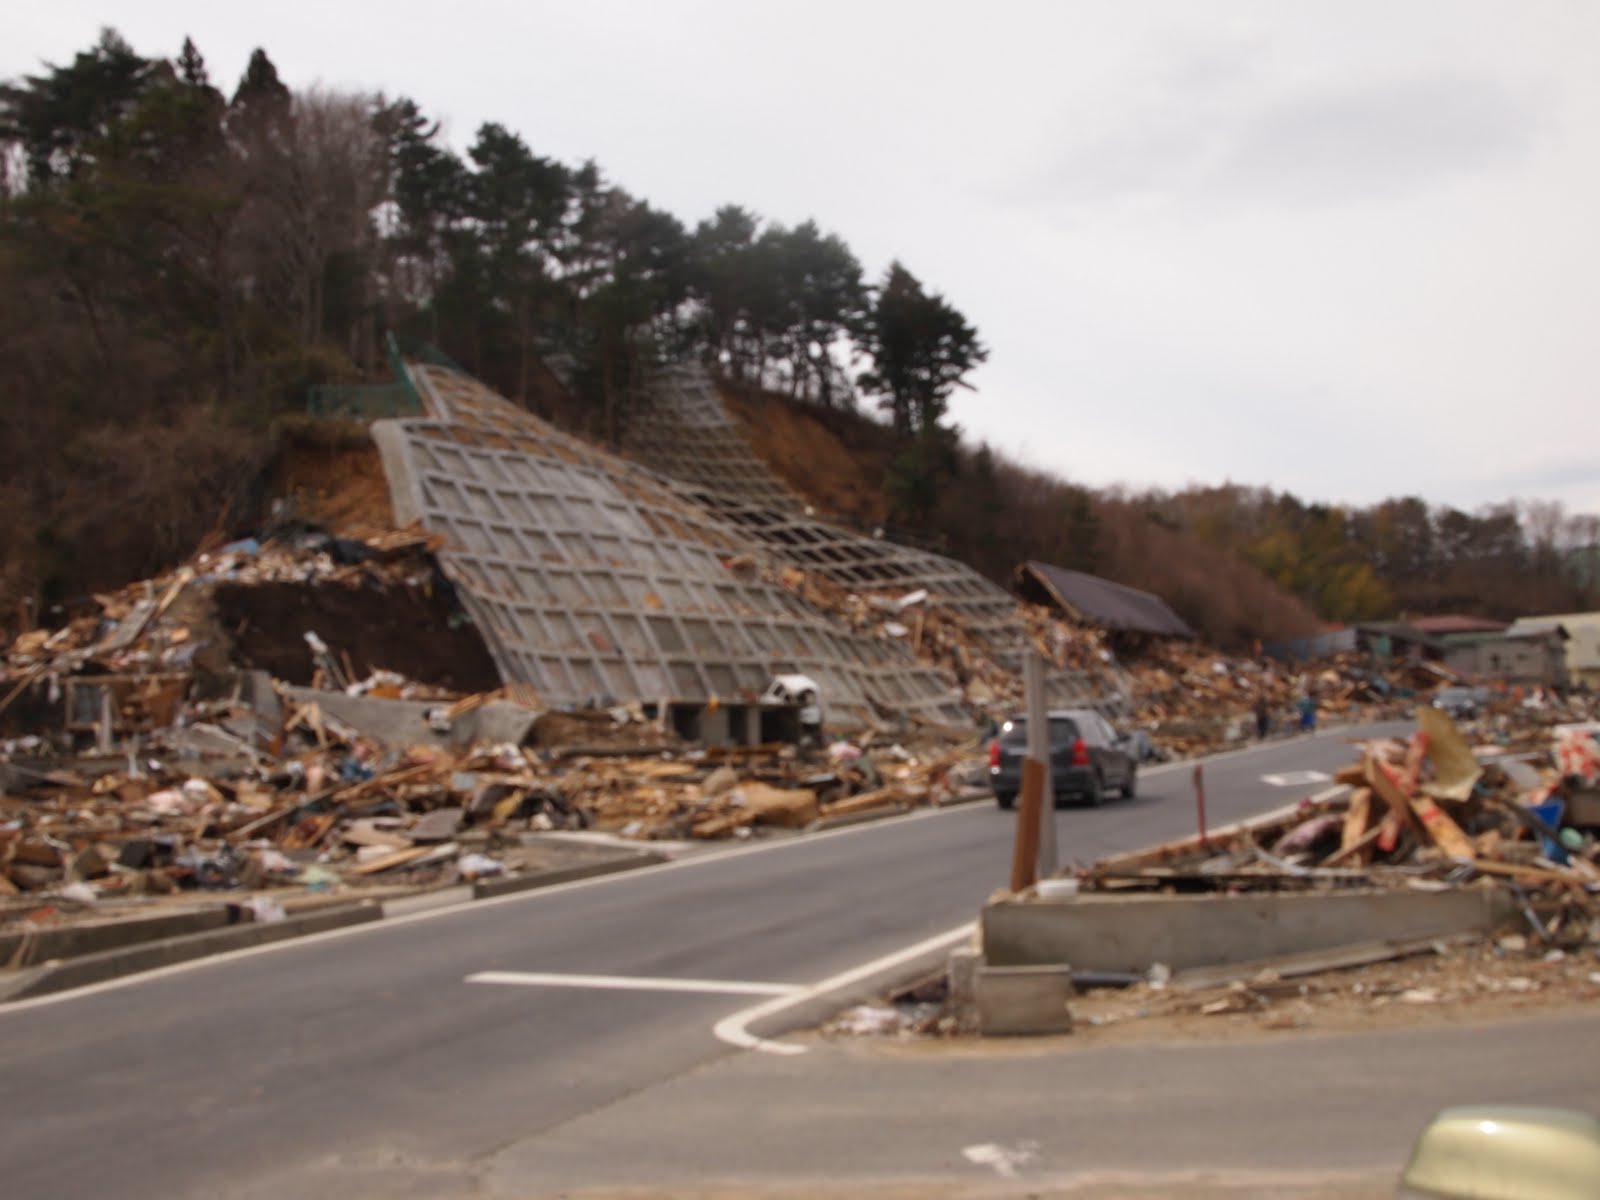
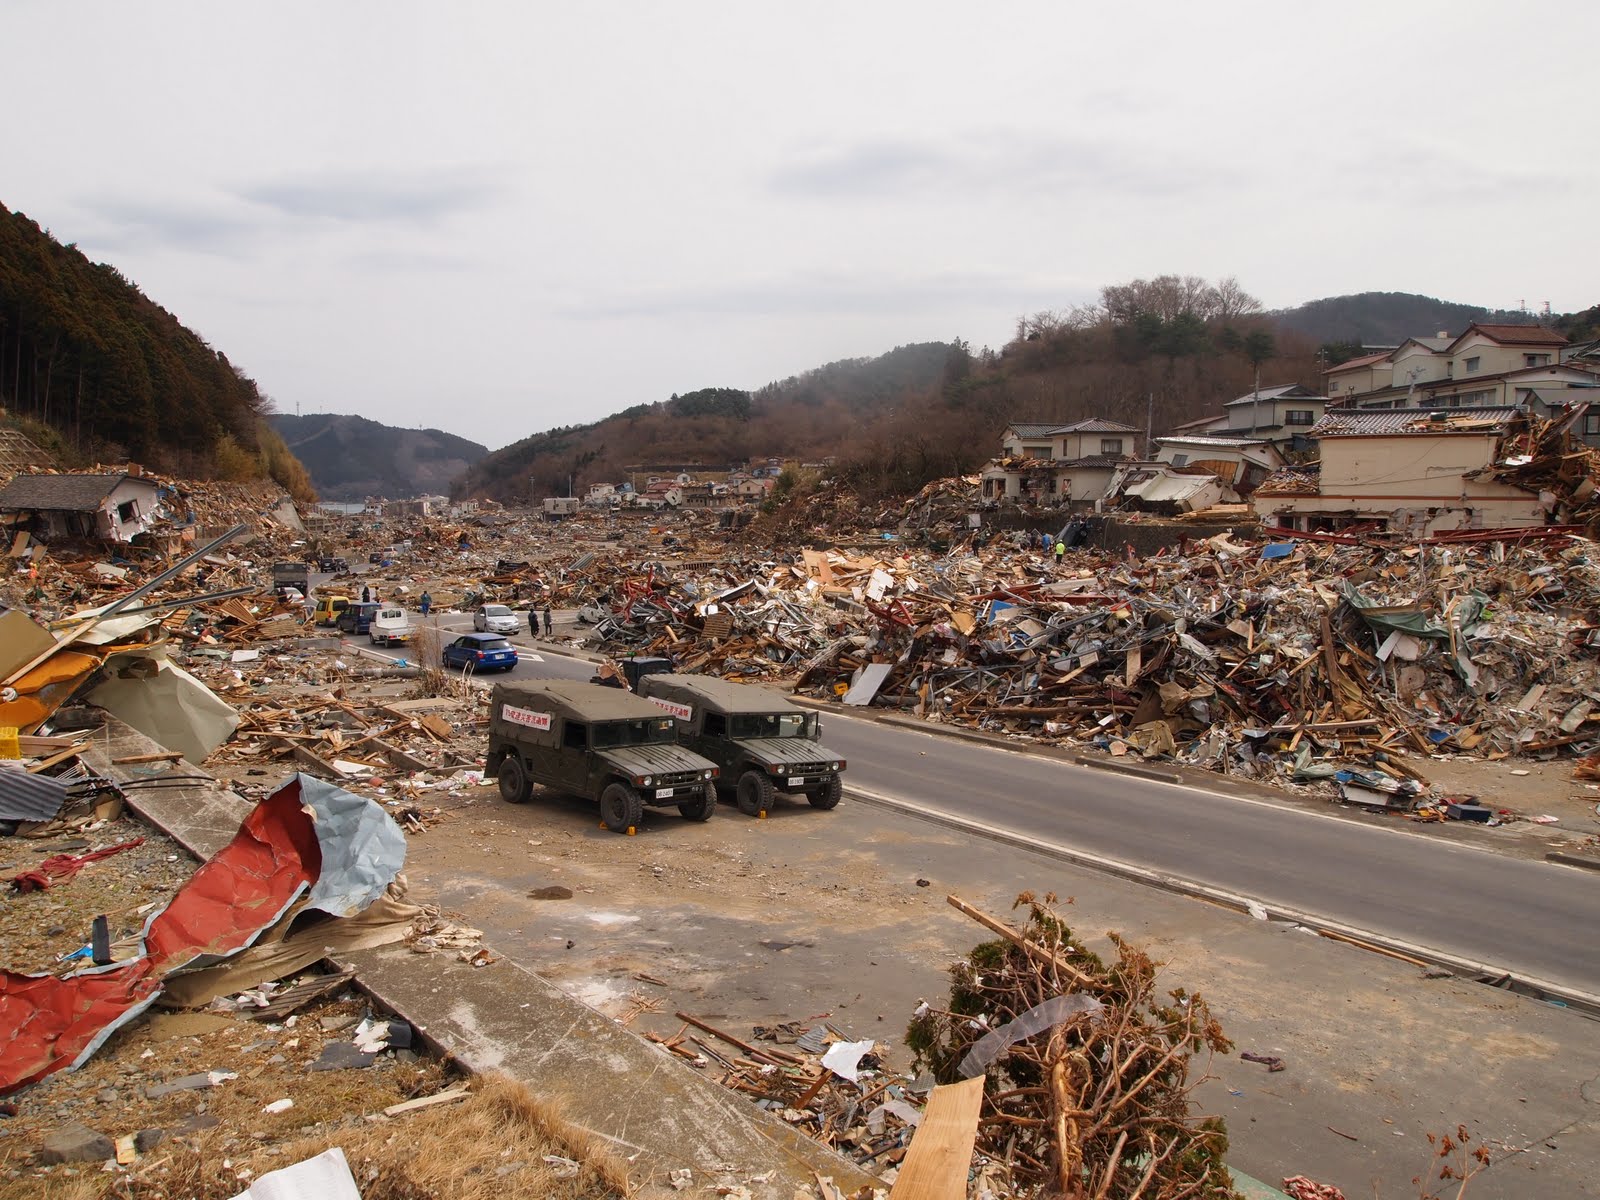
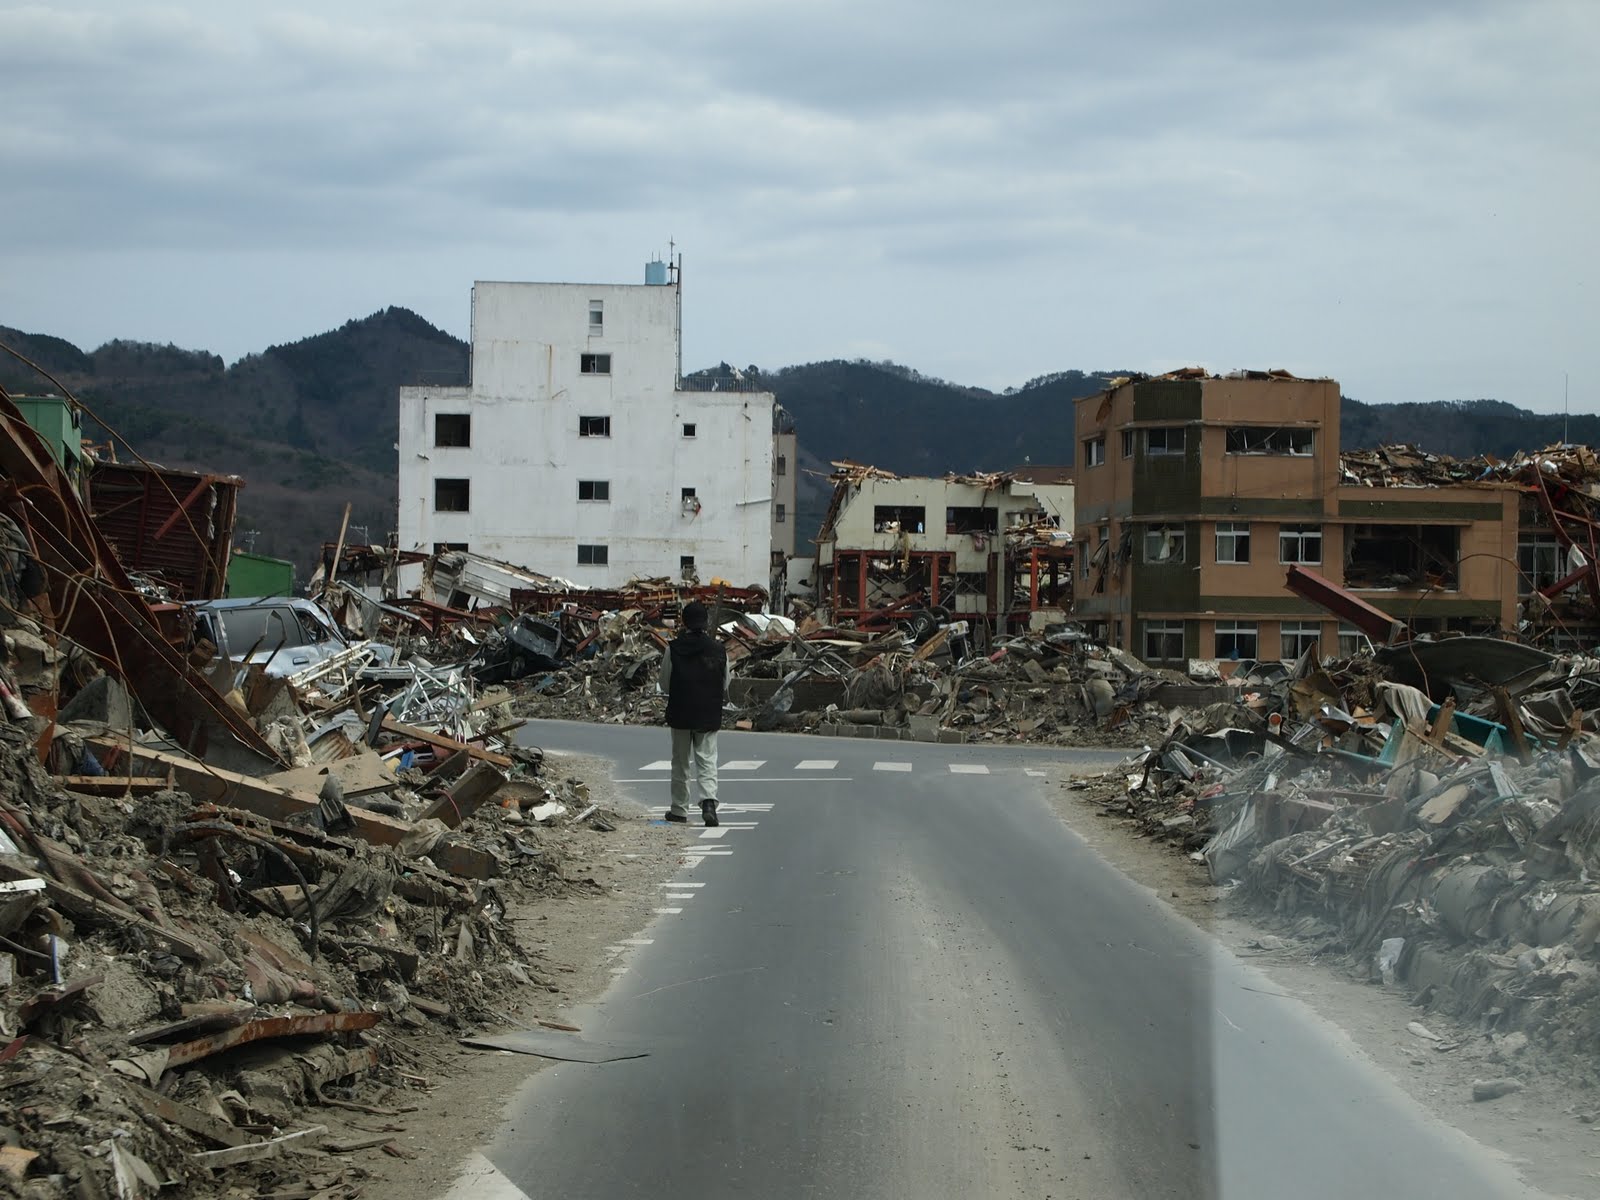
Although there was a portion considered that flooded area was interpreted narrowly a little in the western part, for other areas, the Tsunami Disaster Map well captured the reality, and it was also in agreement with the general condition of the flood area by the Geospatial Information Authority of Japan, and has judged that it is mostly reliable (Photos 1-9).
 |
 |
 |
|
Photo 1. The west end of the tsunami inflow from Onagawa Bay (Eastward shot)
|
Photo 2. West end of the totally damaged area of the Onagawa town (Eastward shot)
|
Photo 3. Totally damaged area and survived area (Southward)
|
|
|
 |
 |
 |
|
Photo 4. The upper limit of the flood of tsunami (Southwestward shot)
|
Photo 5. Totally swept area and survived area (Eastward shot)
|
Photo 6. The entrance of the central area of Onagawa (Eastward shot)
|
|
|
 |
 |
 |
|
Photo 7. Tsunami wave climbed up to the top of 4 stories building and left a car (Southward shot)
|
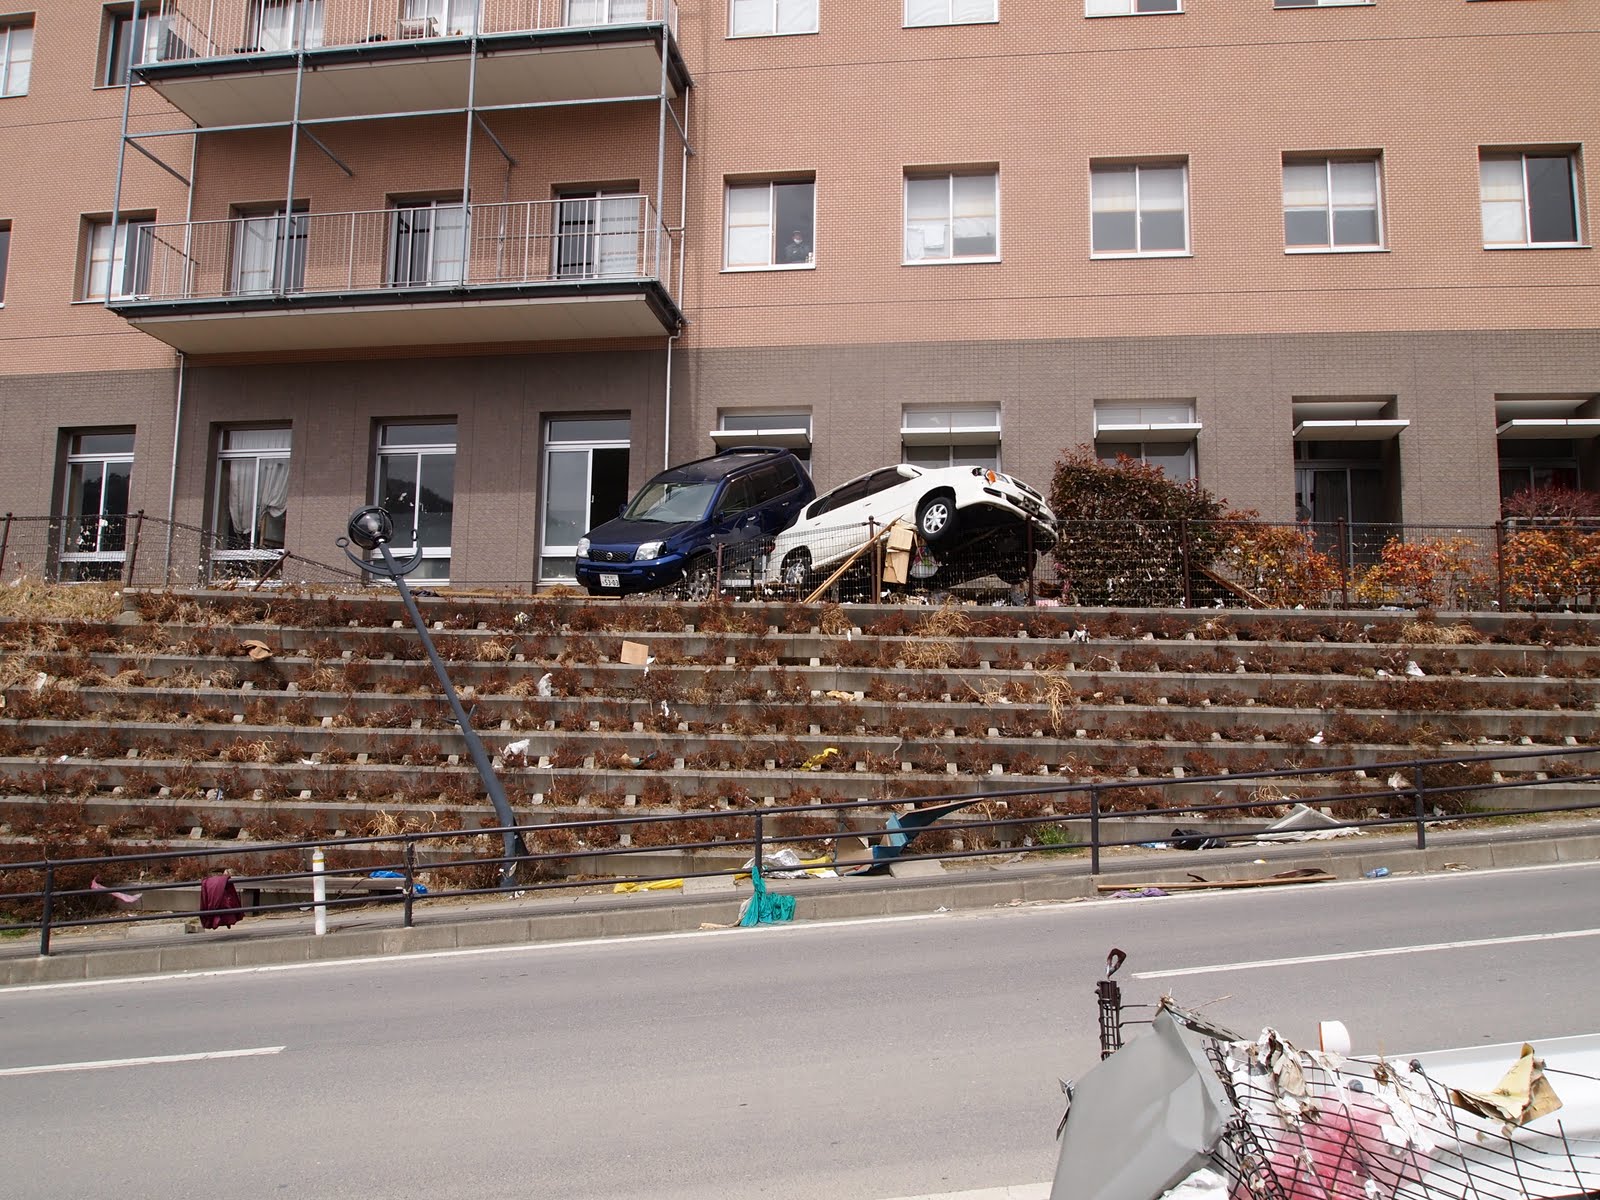
Photo 8. This building is the Onagawa hospital. The ground level of this building is about 16m a.s.l.. Tsunami wave reached to the ceiling of 1st floor of this building. 2 cars are left as a footprint of tsunami.
|
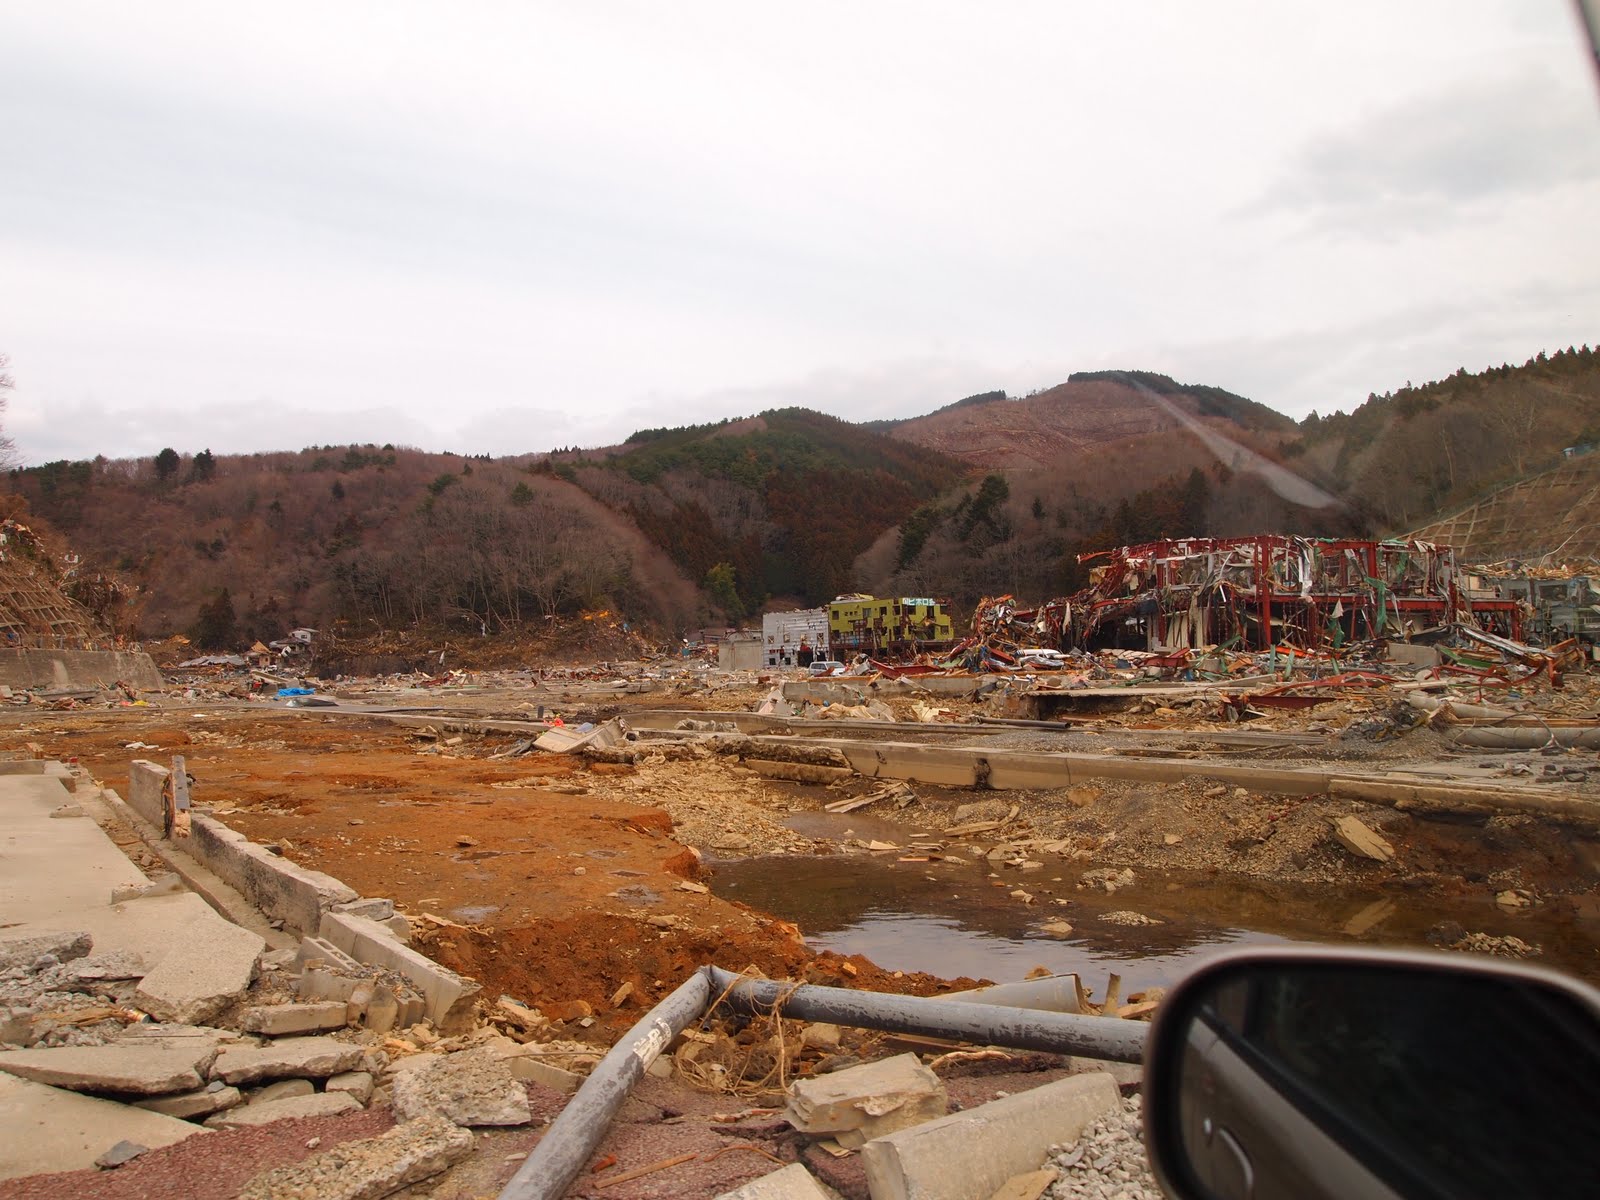
Photo 9. Totally swept suburbs in the northern part of Onagawa railroad station (Northwestward shot)
|
|
|
Watanoha, Nagahama and Sakana-machi districts in Ishinomaki area
 |
 |
|
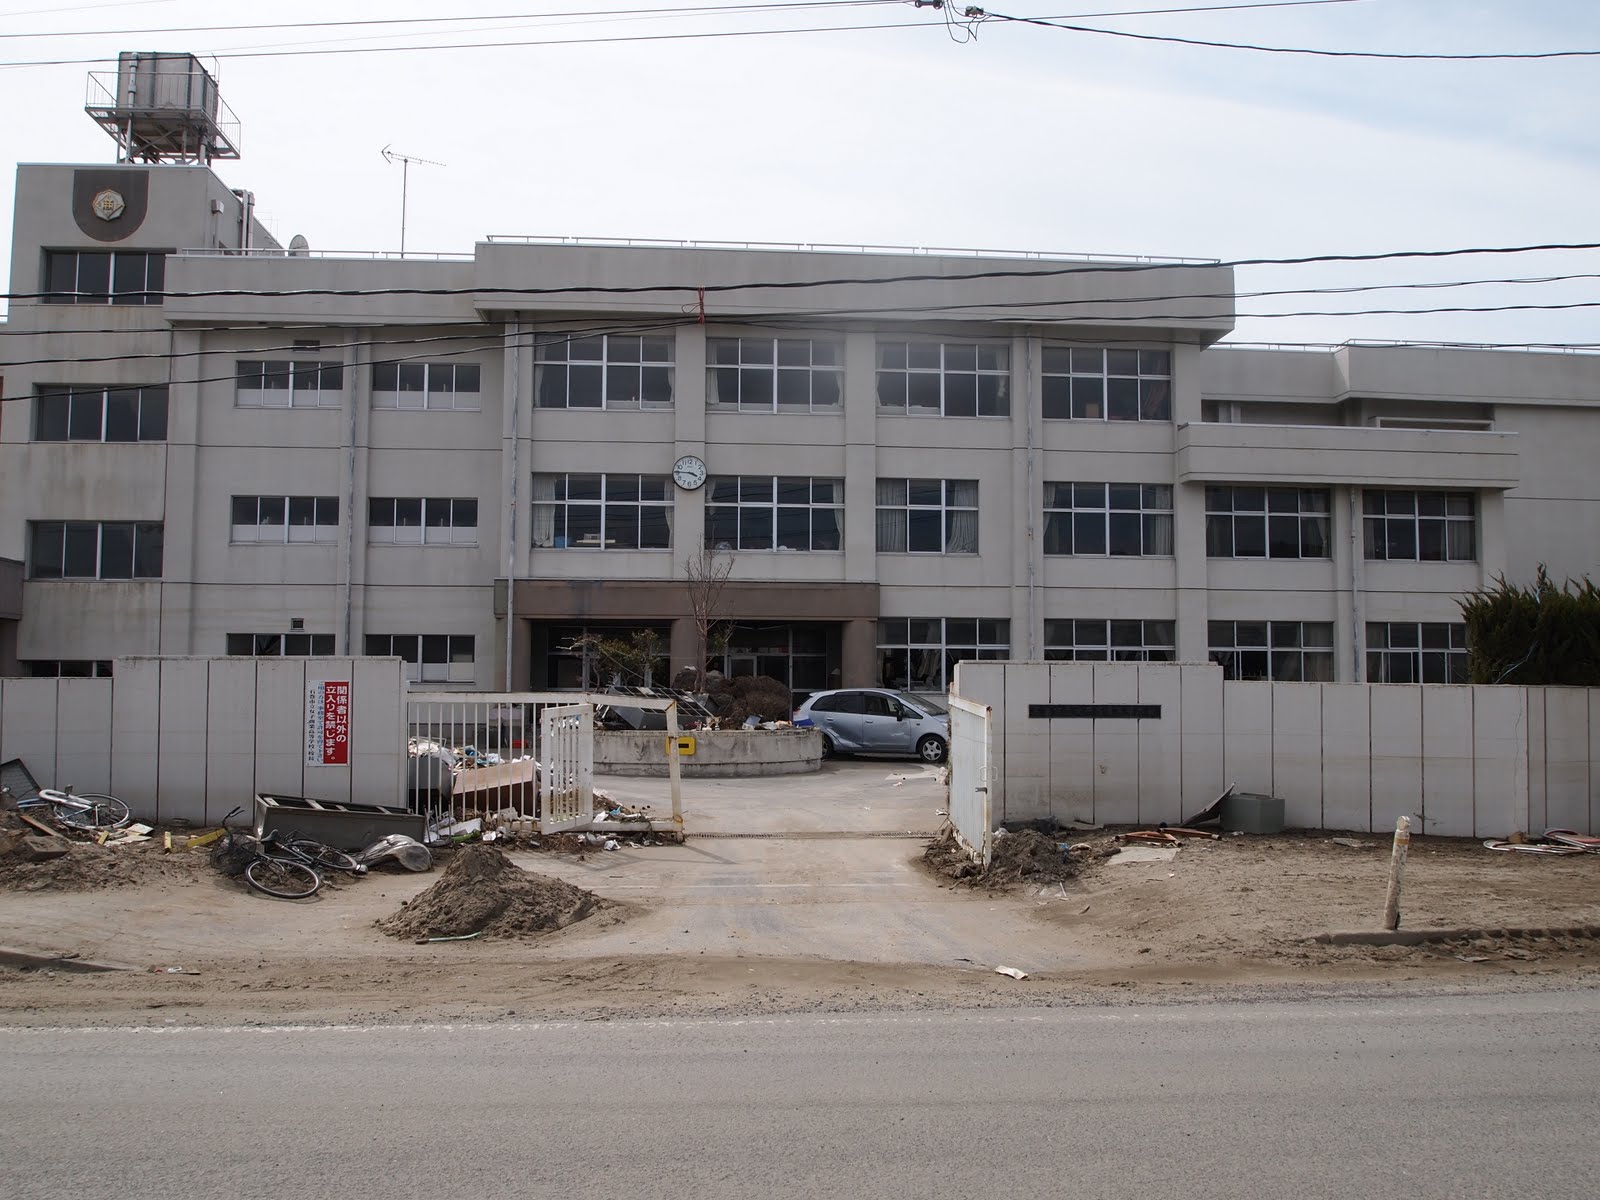
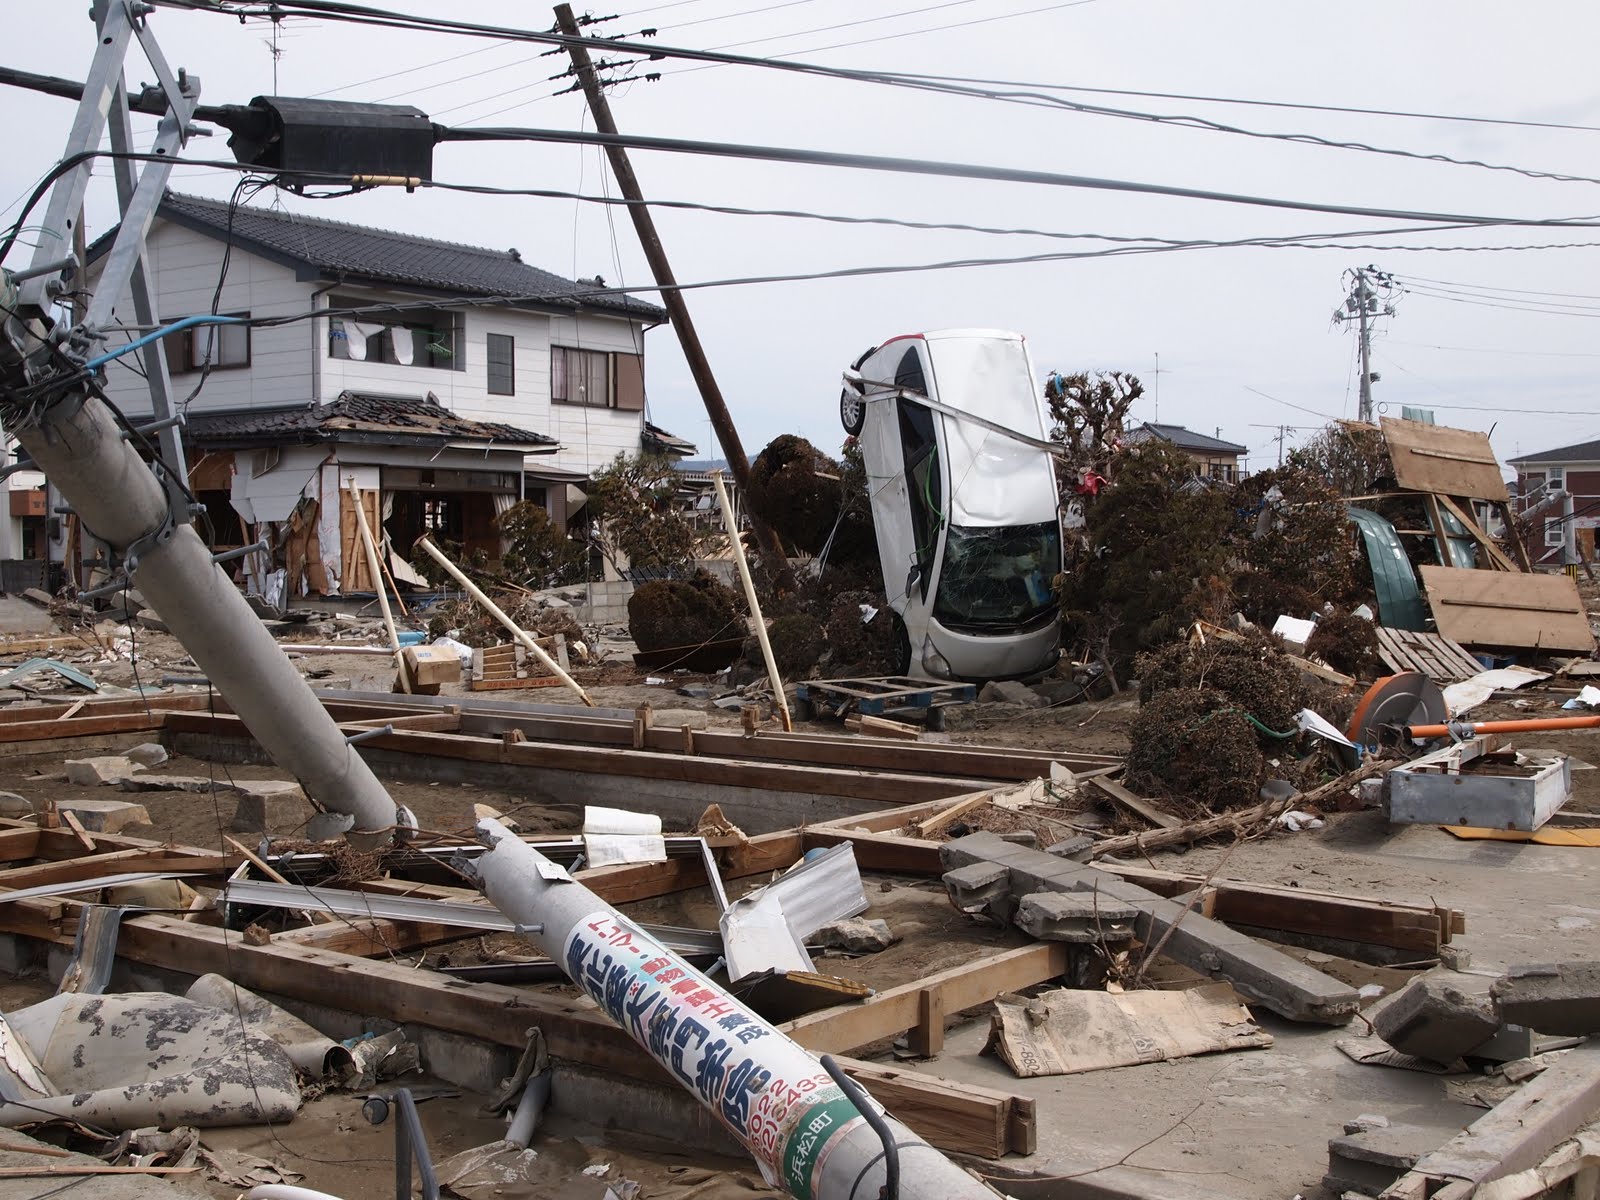
Photo 10. Remained Watanoha Junior Highschool building (Southward shot)
|
Photo 11. Remained 2 stories wooden house and remnants of swept houses (Northeastward shot)
|
|
|
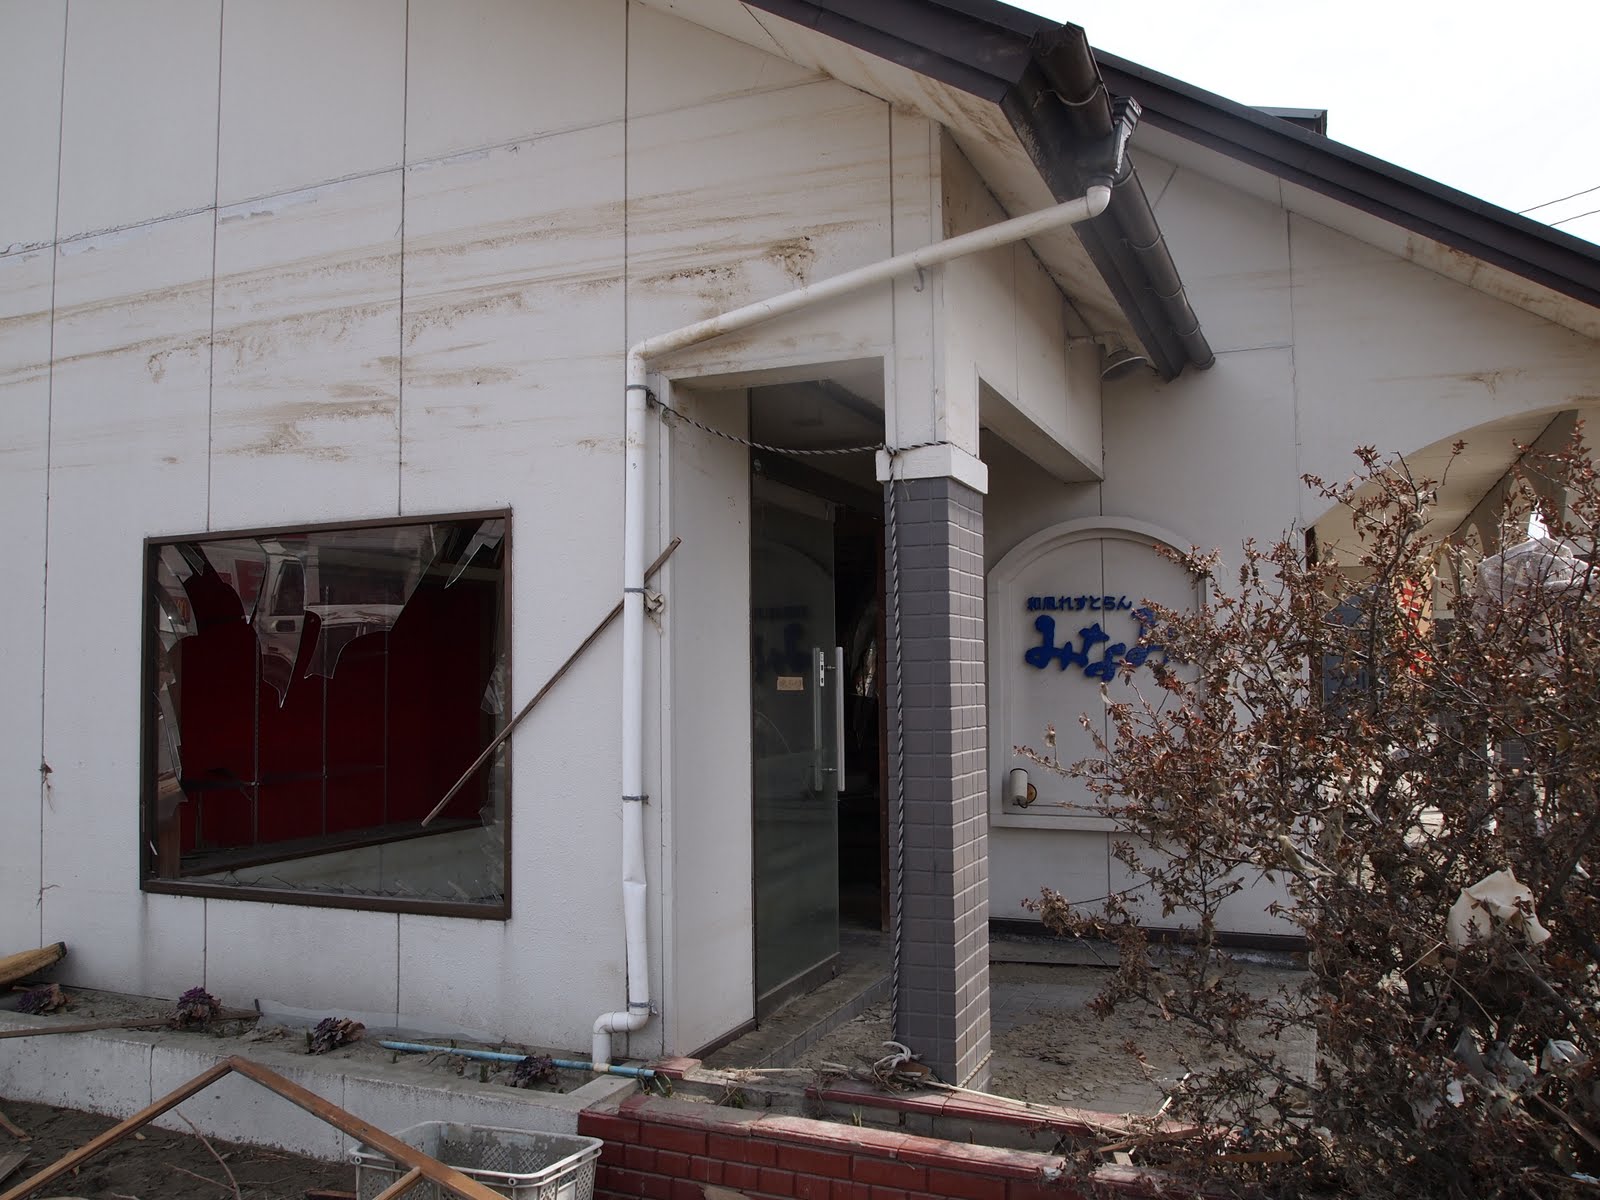
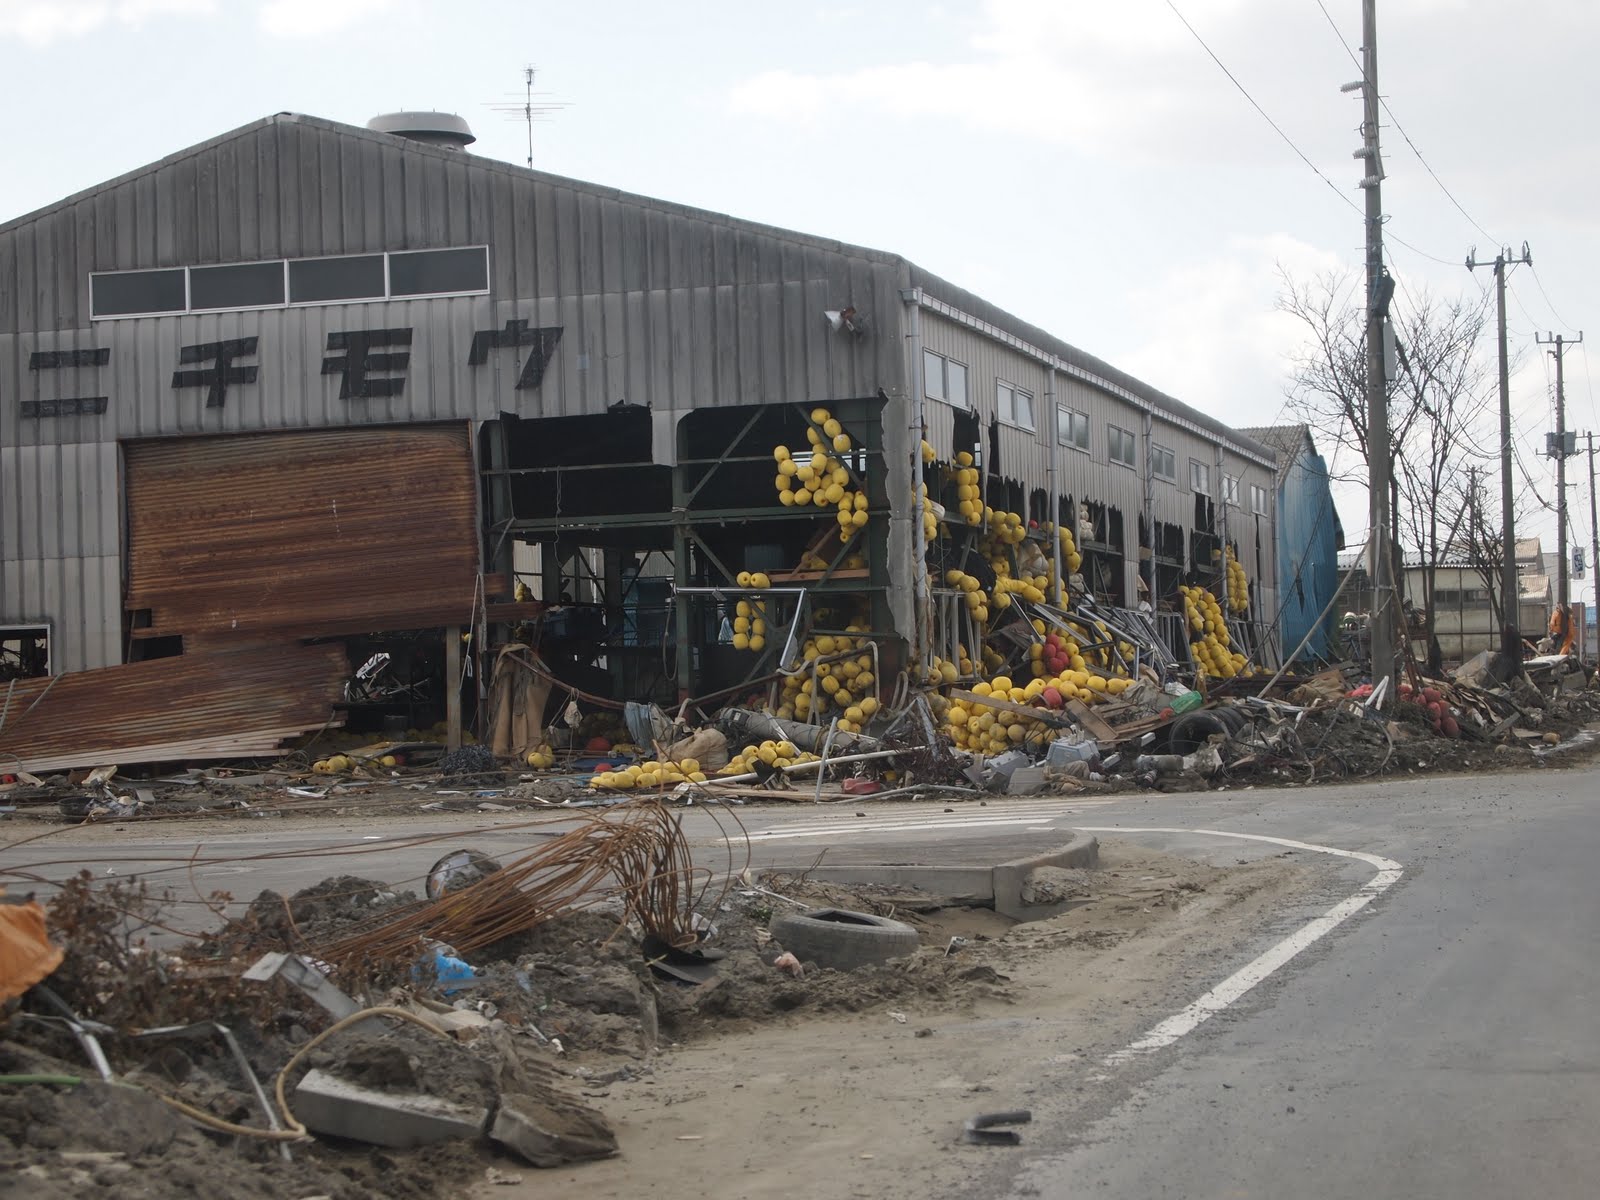
The Tsunami Disaster Map was verified to be reliable in this area as well. “Heavily damaged residential area” in the Tsunami Disaster Map, however, partly disagrees with the area where most of buildings are seriously damaged. Within about 500m inland from the seashore, many residential wooden buildings were washed away and we found the footprints of tsunami in the remained buildings which showed the depth of tsunami of this area was over 3m (Photos 10-11). There were buildings that can be regarded as ‘completely destroyed’ in the Fish Processing Industrial Area, although their steel frame portion and roof remained (Photo 12). In Nagahama district, about 200m width pine tree-fences are planted. It was thought that the tsunami flow became weaker in the back of tree-fence, and there was less damage of educational establishment than that in the Fish Processing Industrial Area (Photo 13).
 |
 |
|
Photo 12. Remained building of restaurant show the footprint of tsunami flood (hight :3.7m )
|
Photo 13. Totally damaged large-sized building in the Fish Processing Industrial Area in Ishinomaki
|
|
|
Right-bank of Old Kitakami River in Ishinomaki area
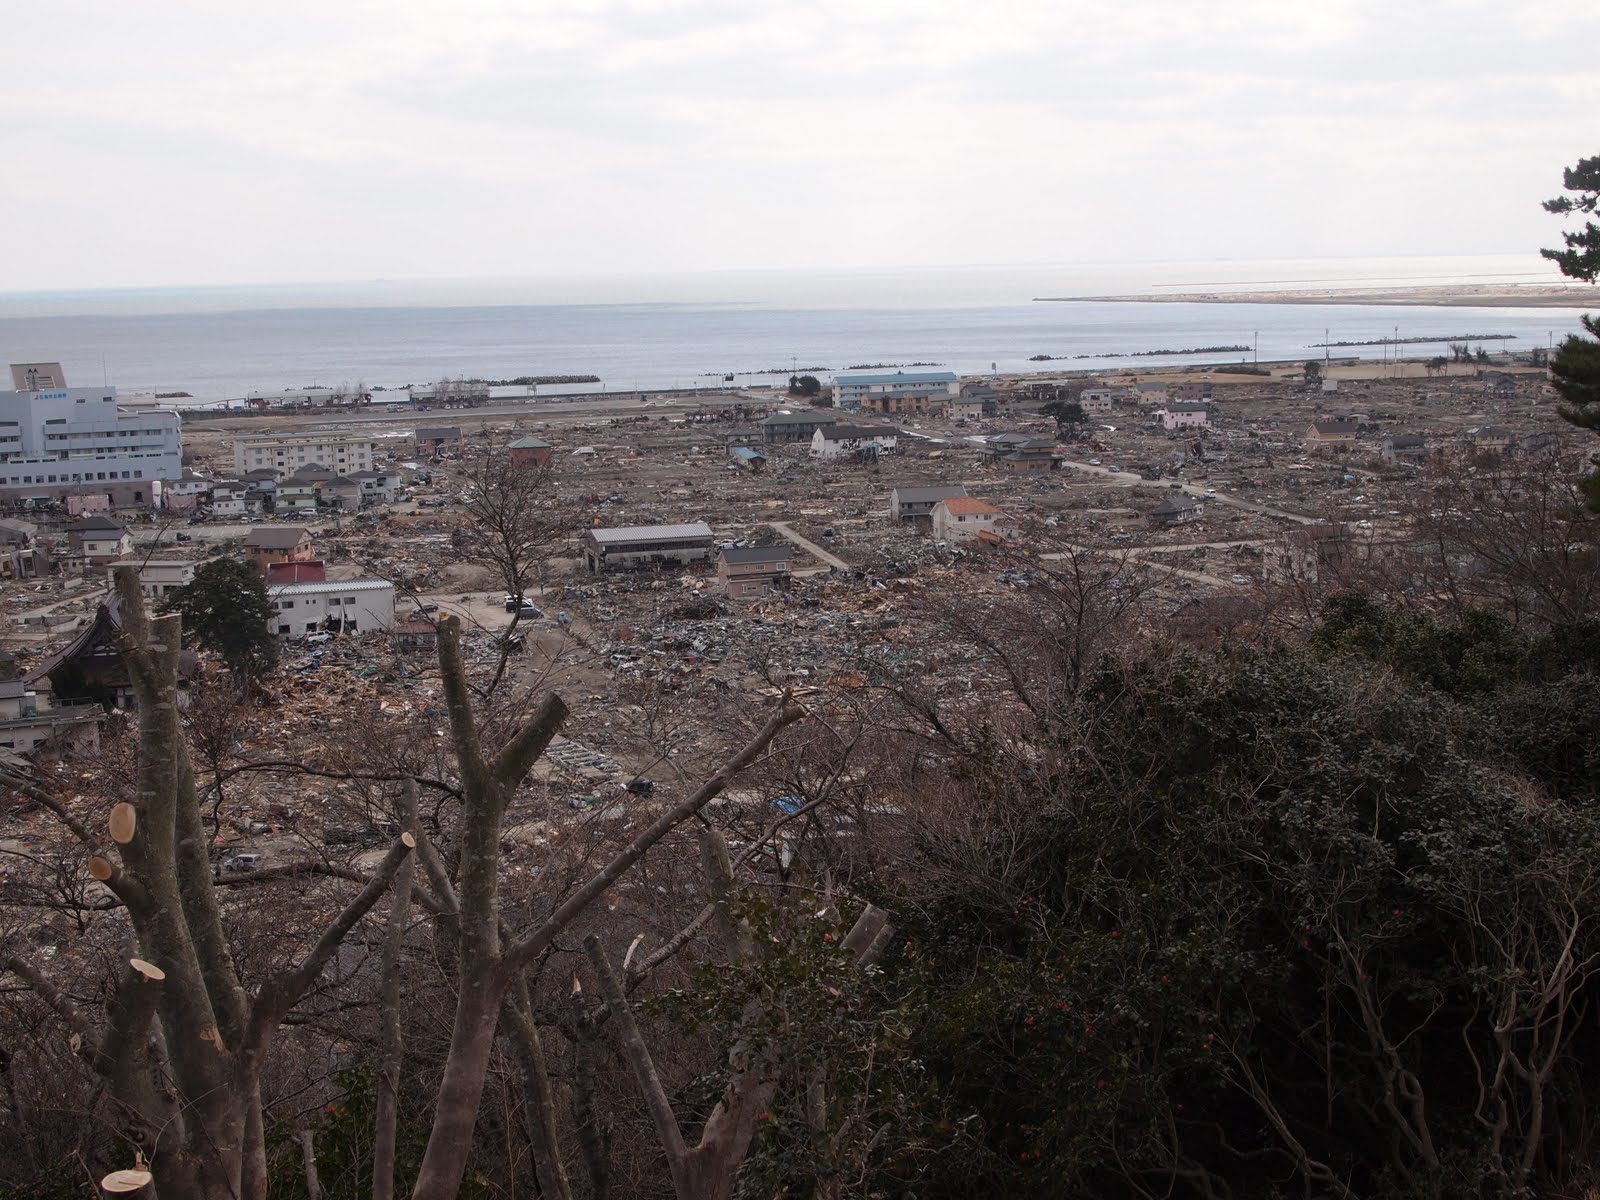
In this area, the damage in which many of houses are washed away in the southern part of the Hiyoriyama Hill, in accordance with the Tsunami Disaster Map. On the Old Kitakami river right bank, it seemed that land subsidence took place and flood area still now was seen (Photos 14- 15). It is thought that the strength of the tsunami flow became weaker as it went north, and the rubbles of building were no longer seen. It seemed that the depth of tsunami flood was over 1m also near the central shopping district (Tachimachi), and the range of inundation above the floor level has prevalent.
 |
 |
|
Photo 14. Totally damaged area in the Southern foot of the Hiyouriyama Hill
|
Photo 15. Mostly swept area in the Minamihama district (Southward shot from Hiyoriyama Hill)
|
|
|
Ookaido district in Ishinomaki area
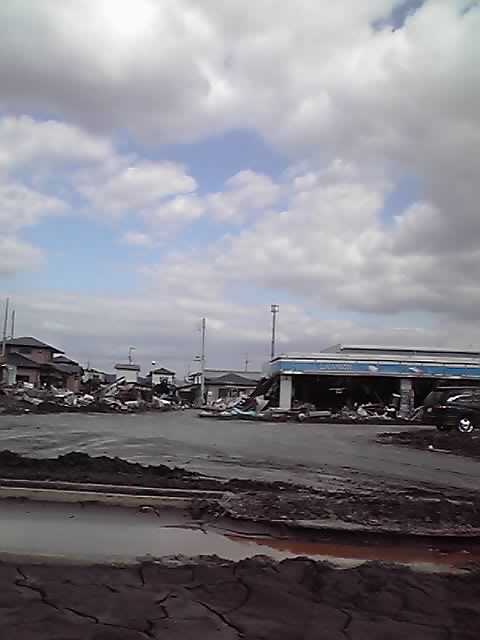
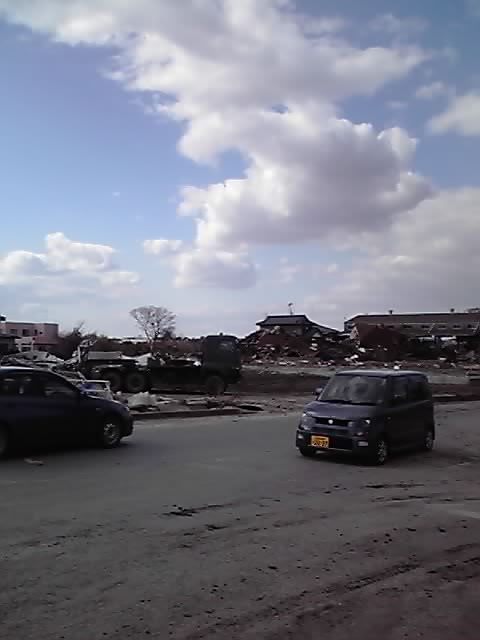
The southern part in this area is still flooded over the large range even 3 weeks after the disaster, since the land subsidence of more than 50cm occurred. Most of houses, however, remained in the inland area where industrial buildings, such as a factory, are locating on the waterfront. These industrial buildings seem to have weakened the flow of tsunami. We found the more than half of the houses washed away in Nakajima-cho where residential district faced shoreline directly. In the Tsunami Disaster Map, although the flooded range is mostly classified as "the heavily damaged residential area”, there are also many portions which were farmland. We thought, it is difficult to interpret whether the flood area is farmland or water covered remnant of wooden residential buildings (Photo 16-17).
 |
 |
|
Photo 16. Land subsidence and damaged building in Okaido district (Eastward shot)
|
Photo 17. Damaged farmland and remained building in Okaido district (Westward shot)
|
|
|
Shimo-iida and peripheral district in Sendai City
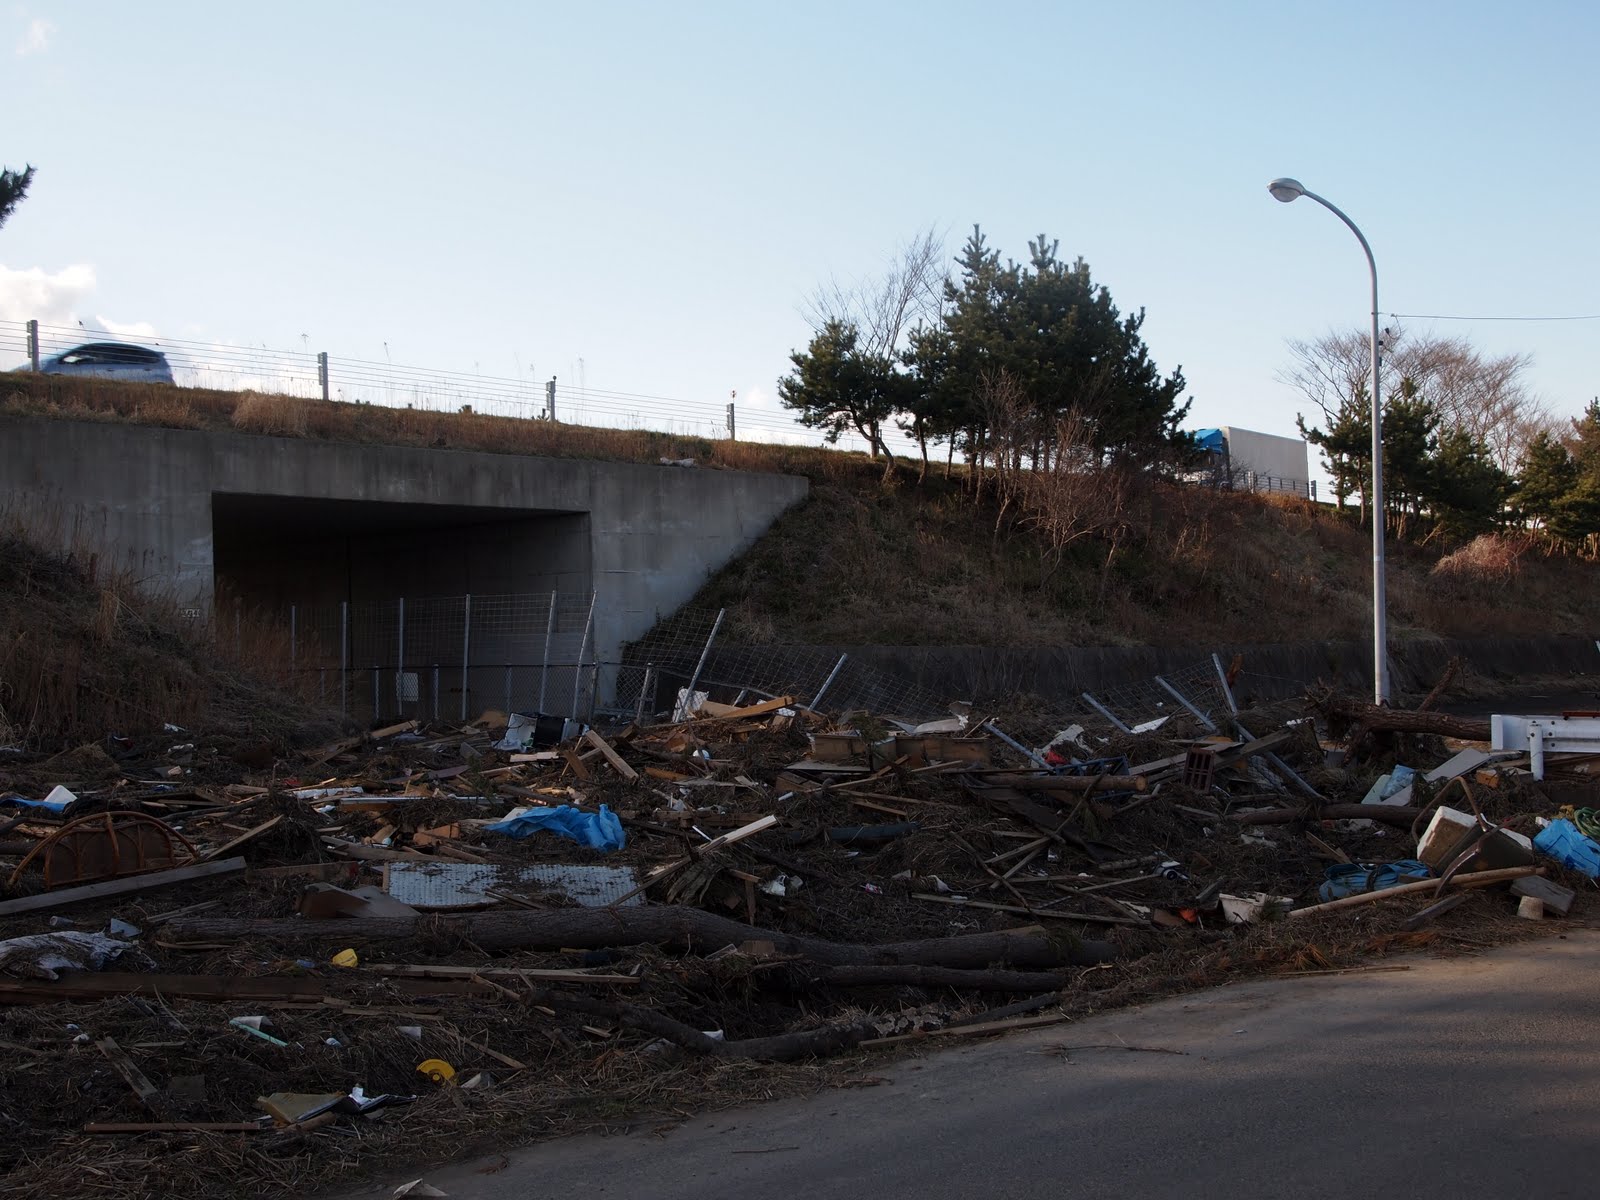
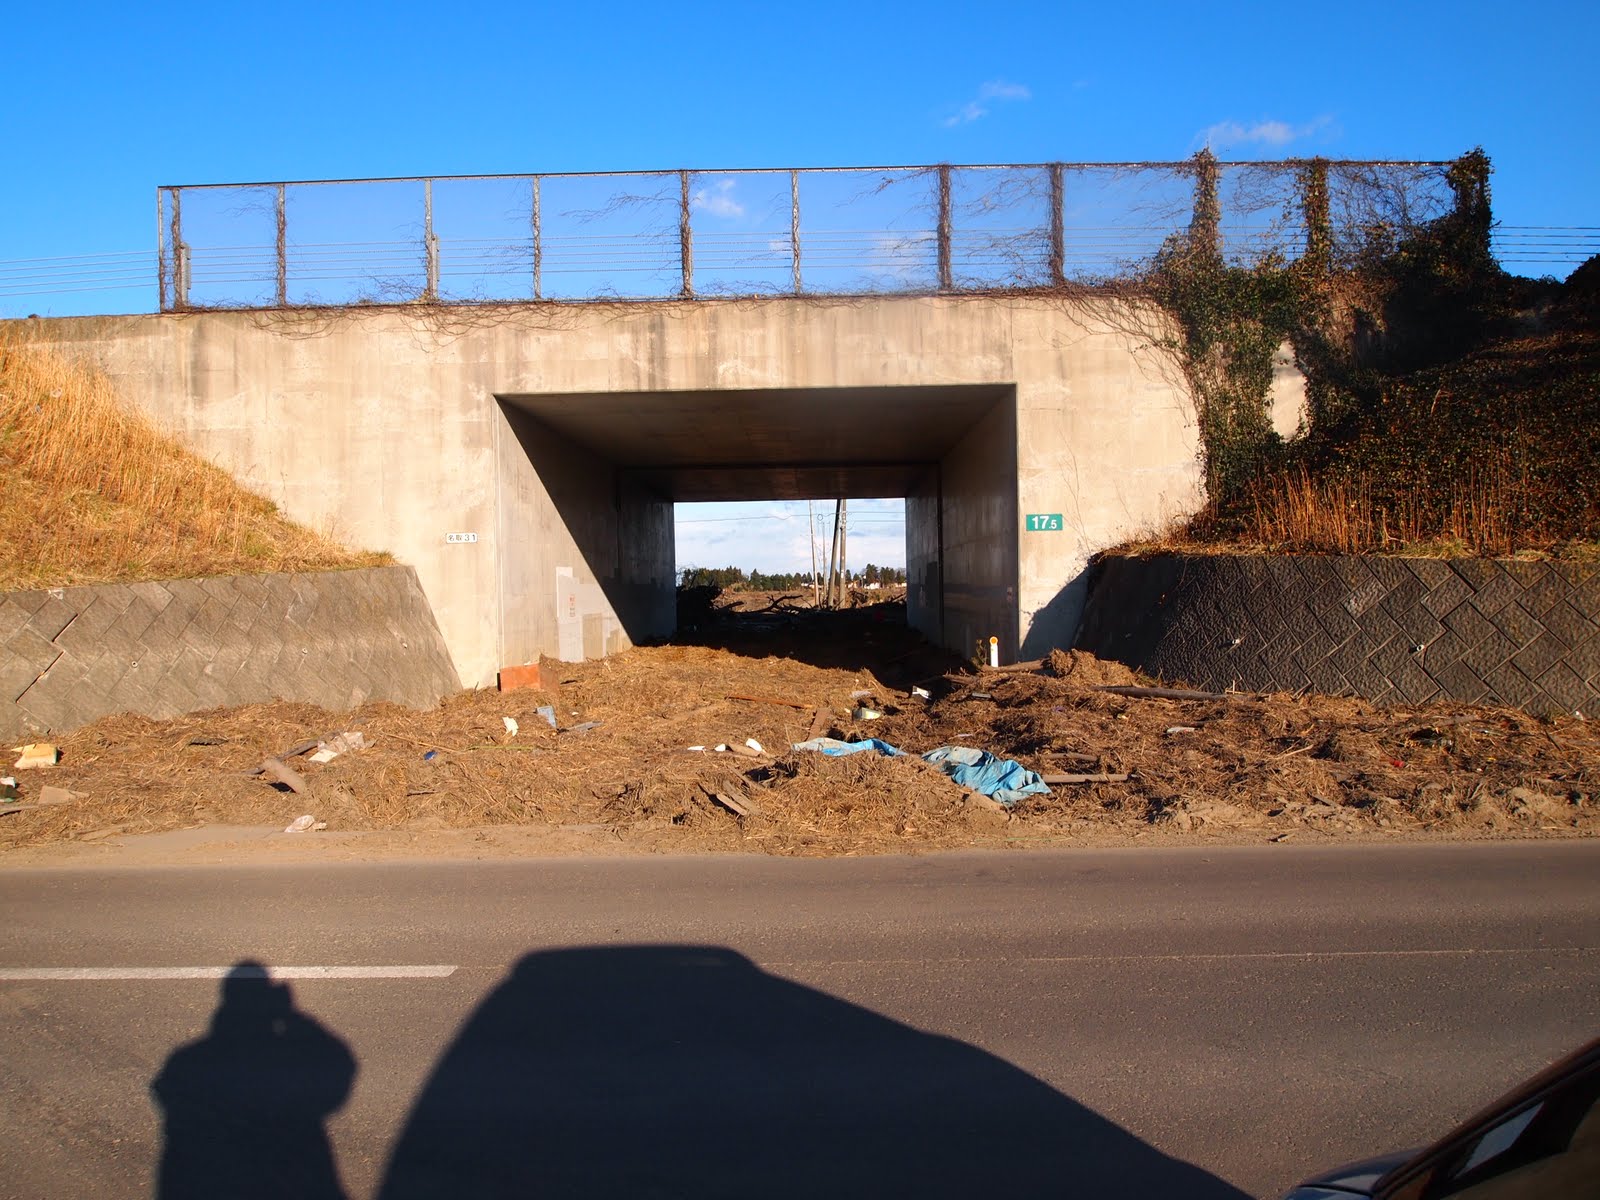
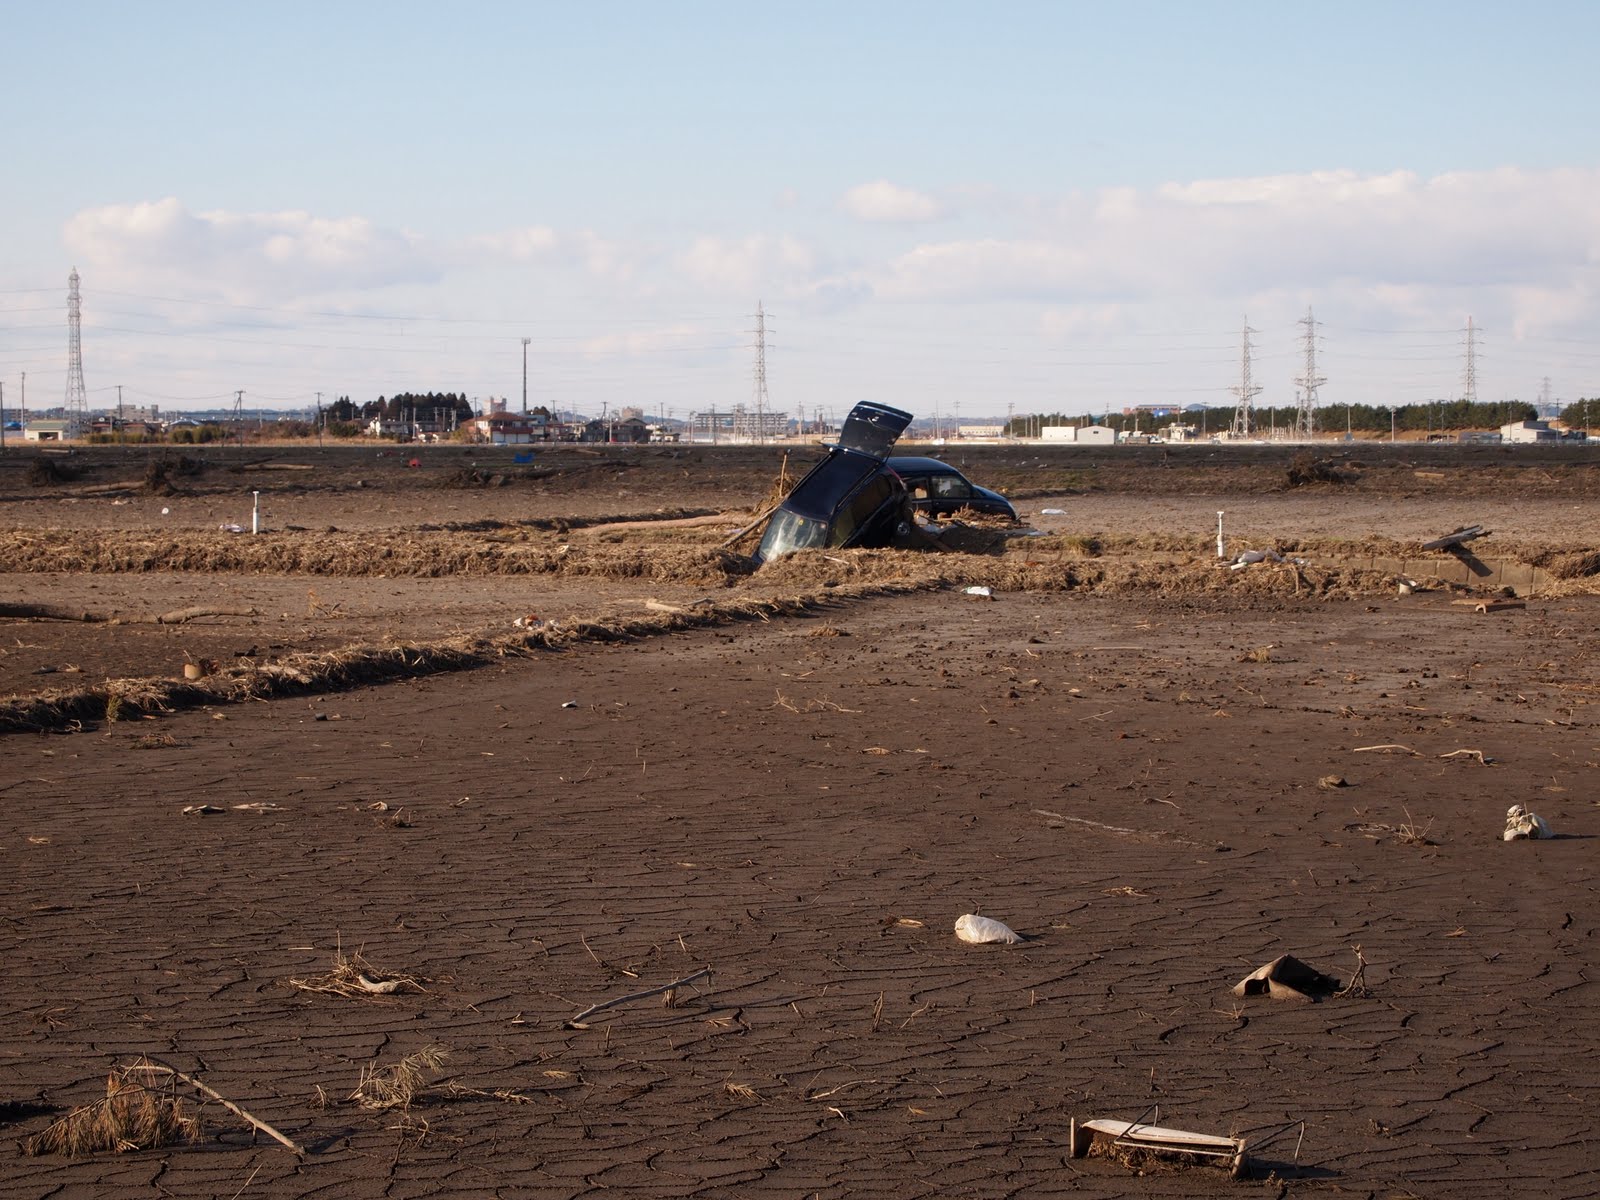
In this area, the Sendai Tobu Highway is elevated 6m higher than farmland and residential areas. Although the large part of the Sendai Tobu Highway is mounted, a part of the Highway is elevated bridge. The east side of the laid earth highway mostly serves as a limit of the flood area. The depth of flood was considered to be 2m or less (Photo 18). It seemed that the strong and narrow tsunami flow to the west happened through underpass of the Sendai Tobu Highway, and underpass’s width is about 4m. We found drift vehicles in the west side nearby the Sendai Tobu Highway (Photo 19- 20).
 |
 |
 |
|
Photo 18. East side of the Sendai East Highway (Westward shot)
|
Photo 19. Narrow underpass of the Sendai East Highway and wreckage of tsunami
|
Photo 20. Drift vehicle in the west side of the Sendai East Highway (Northwestward shot)
|
|
|
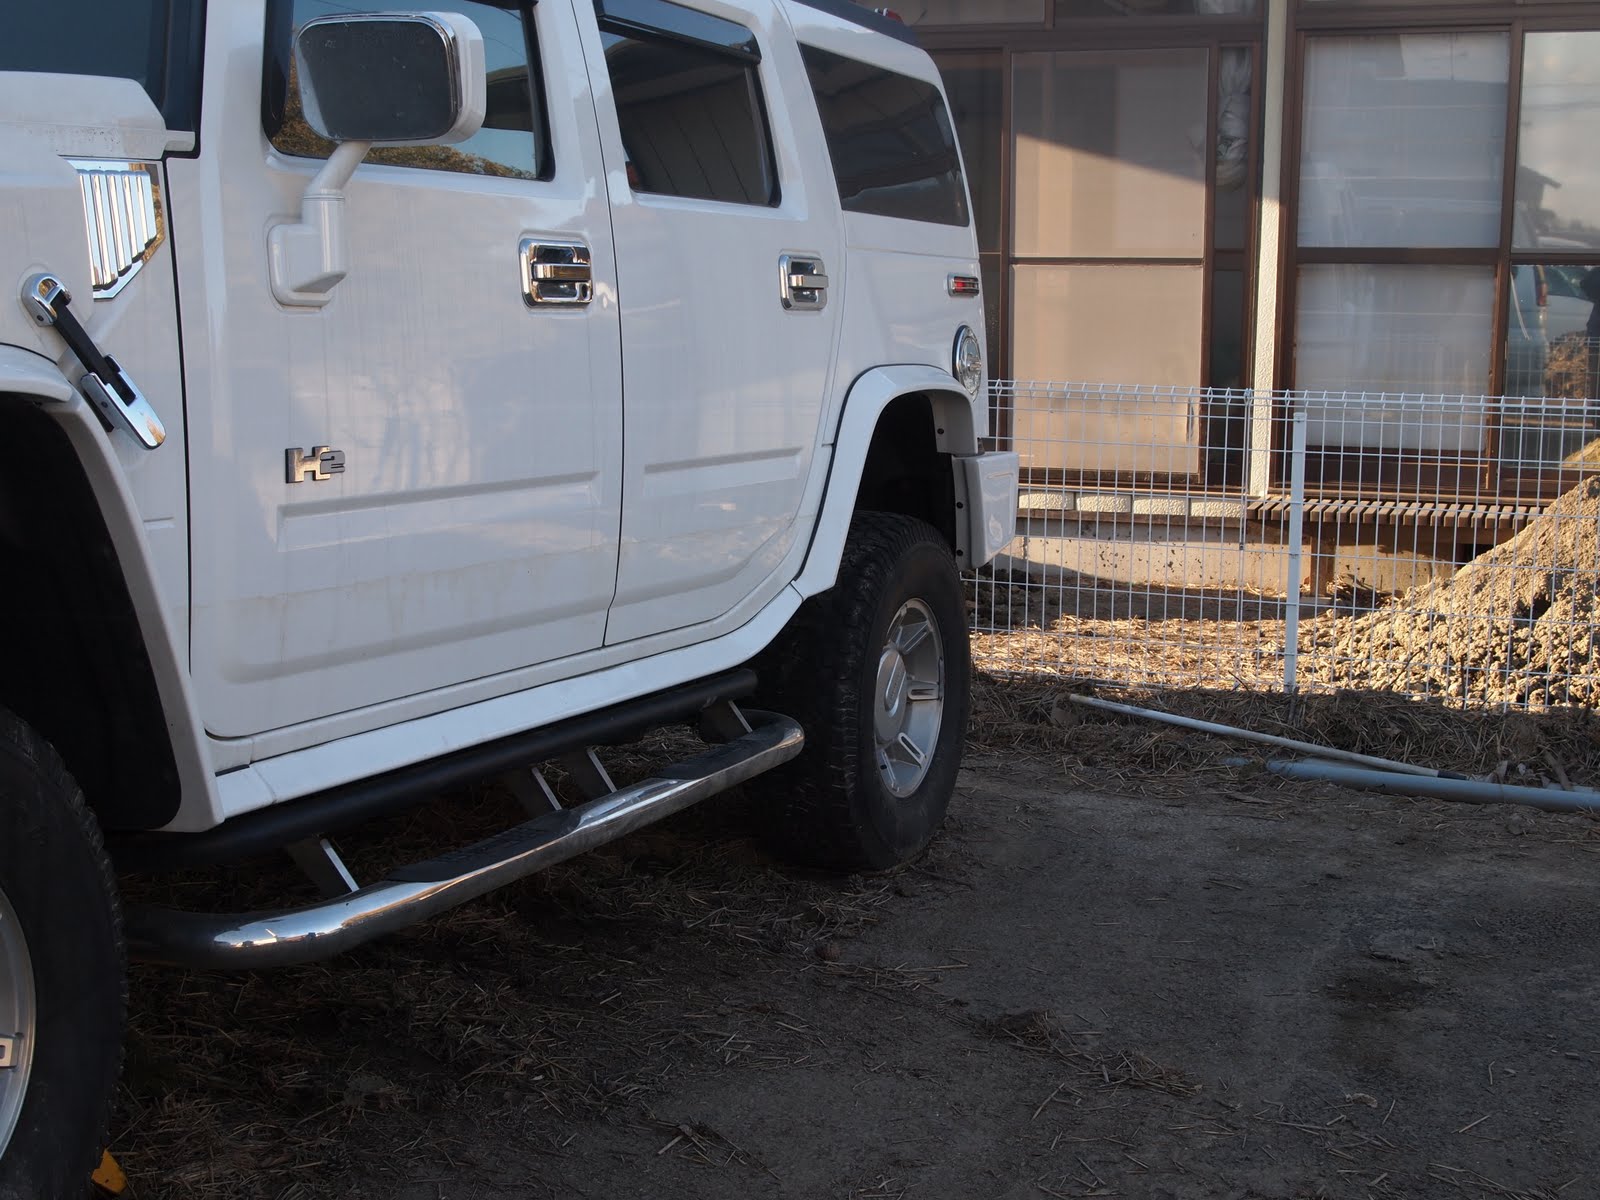
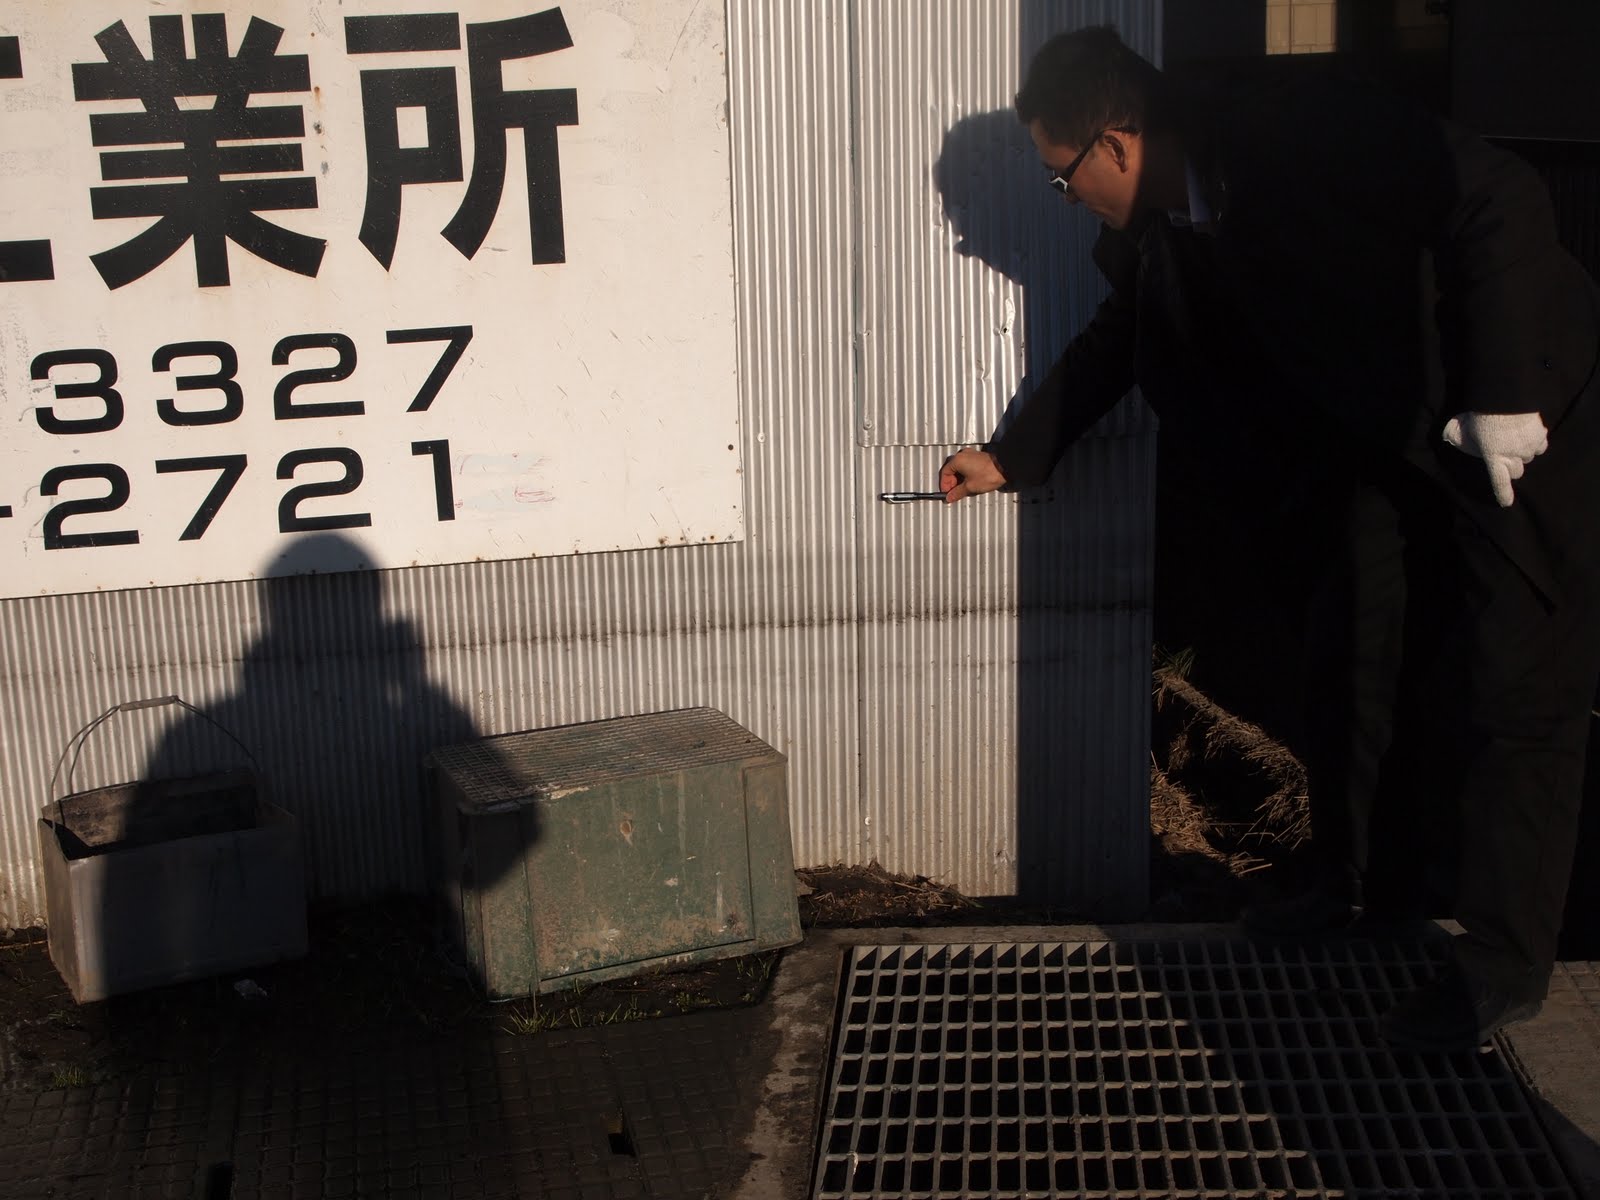
The investigation of the residential area of the east side of the Sendai East Highway was not completed because of the restriction of entrance, in Fujita district, it seemed that the depth of flood was less than 1m, and the collapse of the house was not seen there. In the west side of the elevated highway portion, the depth of flood was considered to be less than 1m and inundation in many of houses in Shimo-Iida were above the floor level. It seems that the flooding remained under floor Rokugo district (Picture 21, 22).
 |
 |
 |
|
Photo 21. Tsunami footprint on the car in Shimo-iida district
|
Photo 22. Tsunami footprint on the wall in Shimo-iida district
|
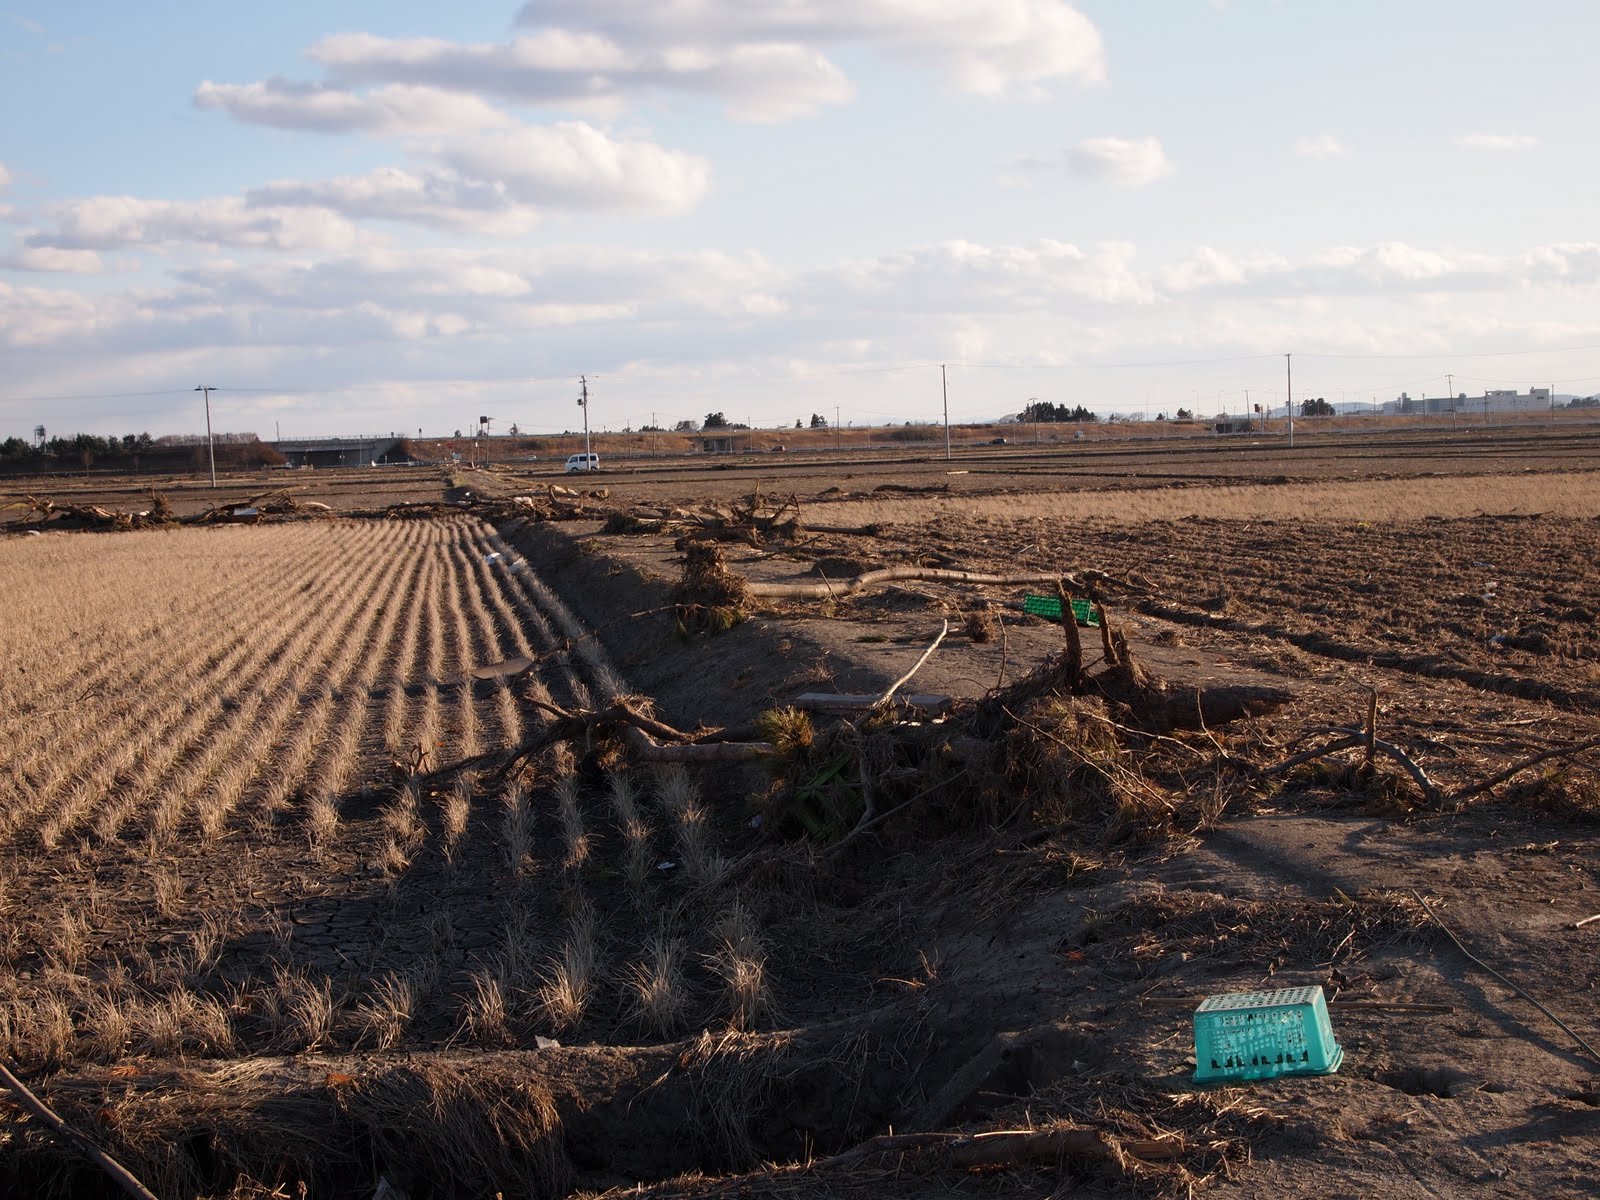
Photo 23. The wreckage on the paddy field in Shimo-iida district |
|
|
The Tsunami Disaster Map of this district is mostly verified. The strength of tsunami flow, however, depends on the structure of the Sendai Tobu Highway; whether it is mounted or elevated. We can identify partly the strength and depth of tsunami flow by checking the materials of wreckage (vehicles, trees or grass). The distribution of damaged vehicles should be good indicator of the boundary of strong and deep tsunami inflow (Picture 23).
Copyright(C)2006- The Tohoku Geographical Association
|


