
Population in areas affected by the 2011 tsunami off the Pacific coast caused by the Tohoku Earthquake: From Sanriku coast to Sendai Bay area
The 2011 East Japan Earthquake Bulletin of the Tohoku
Geographical Association
7 May, 2011
Hitoshi MIYAZAWA, Associate Professor,
Ochanomizu University
Email: miyazawa.hitoshi(a)ocha.ac.jp
Objective
Huge tsunami waves accompanying the 2011 off the Pacific coast of Tohoku Earthquake that occurred on March 11, 2011 caused severe damage to the Pacific coast in the Tohoku and Kanto districts. Because stricken areas extend widely, all aspects of the damage have not been comprehended yet, even more than one month after the earthquake. This study elucidates the night population of the tsunami inundation range before the calamity based on 2010 Population Census results. The information provides clues to understanding the scale of damage level and provides basic data to support restoration plans.Data and procedures used for this work are described below.
Data
(1) Tsunami inundation rangeThe "Maps of the area hit by the tsunami of 11 March 2011, northeast Japan"1) was prepared by the tsunami damage mapping team of the disaster task force of the Association of Japanese Geographers (AGP). Permission to use the data was granted by the team. The author supplemented them with data based on satellite images of the disaster areas2) obtained from Google for some areas of the Sanriku coast, Iwate, which are not shown in the AGP map.
(2) Demographic statistics
Night population and the number of households from the 2010 Population Census (preliminary figures) were obtained for areas demarcated by the boundaries of basic unit blocks (census blocks) under consolidation3). Permission for use was granted from the Statistics Bureau, the Ministry of Internal Affairs and Communications for disaster analysis.
Procedure
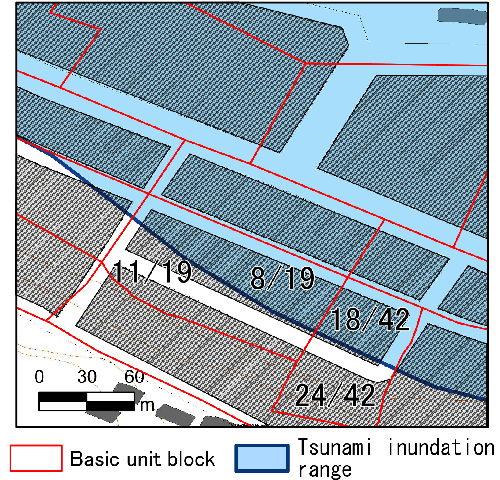
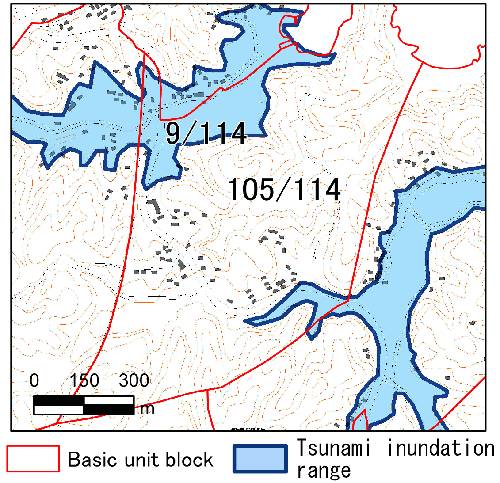
Overlay processing was performed using data (1) and (2) with GIS. The population was summed separately for areas inside and outside of the tsunami inundation range. The population of basic unit blocks that are partially inundated was divided proportionally to populations inside and outside of the tsunami inundation range4), according to a) areas in basic unit blocks comprising densely built-up areas in 1:25,000 topographic map; otherwise, b) the number of buildings obtained by Fundamental Geospatial Data (accuracy level 25,000). In all, 29 local governments in the coast area of Iwate and Miyagi prefectures were chosen as the subject of summation, where the data of tsunami inundation range are available in data (1).Similar summation work has already been conducted by Prof. Kenji Tani of Saitama University5) and the Statistics Bureau6). The former includes Fukushima prefecture in the subject for the estimate based on the original data of the tsunami inundation range, although the statistical data that were used are grid square statistics in 2005. However, the latter, counted by the Statistics Bureau, uses summed results according to basic unit blocks of the 2010 Population Census (preliminary figures), as this study does. No proportional division of population was conducted for basic unit blocks that were partially inundated by the tsunami.
Results
The night population in the tsunami inundation range was estimated using the procedure described above: approximately 64,000 in 12 locally governed areas along the coast of Iwate prefecture (23.3% of the total population of 12 locally governed areas, and 4.8% of the total population of Iwate), and 235,000 in 17 locally governed areas along the coast of Miyagi prefecture (19.4% of total population of 17 locally governed areas, and 10.0% of the total population of Miyagi) (Table 1).| Table 1. Population and number of households in the tsunami inundated area: Sanriku coast to the Sendai Bay area |
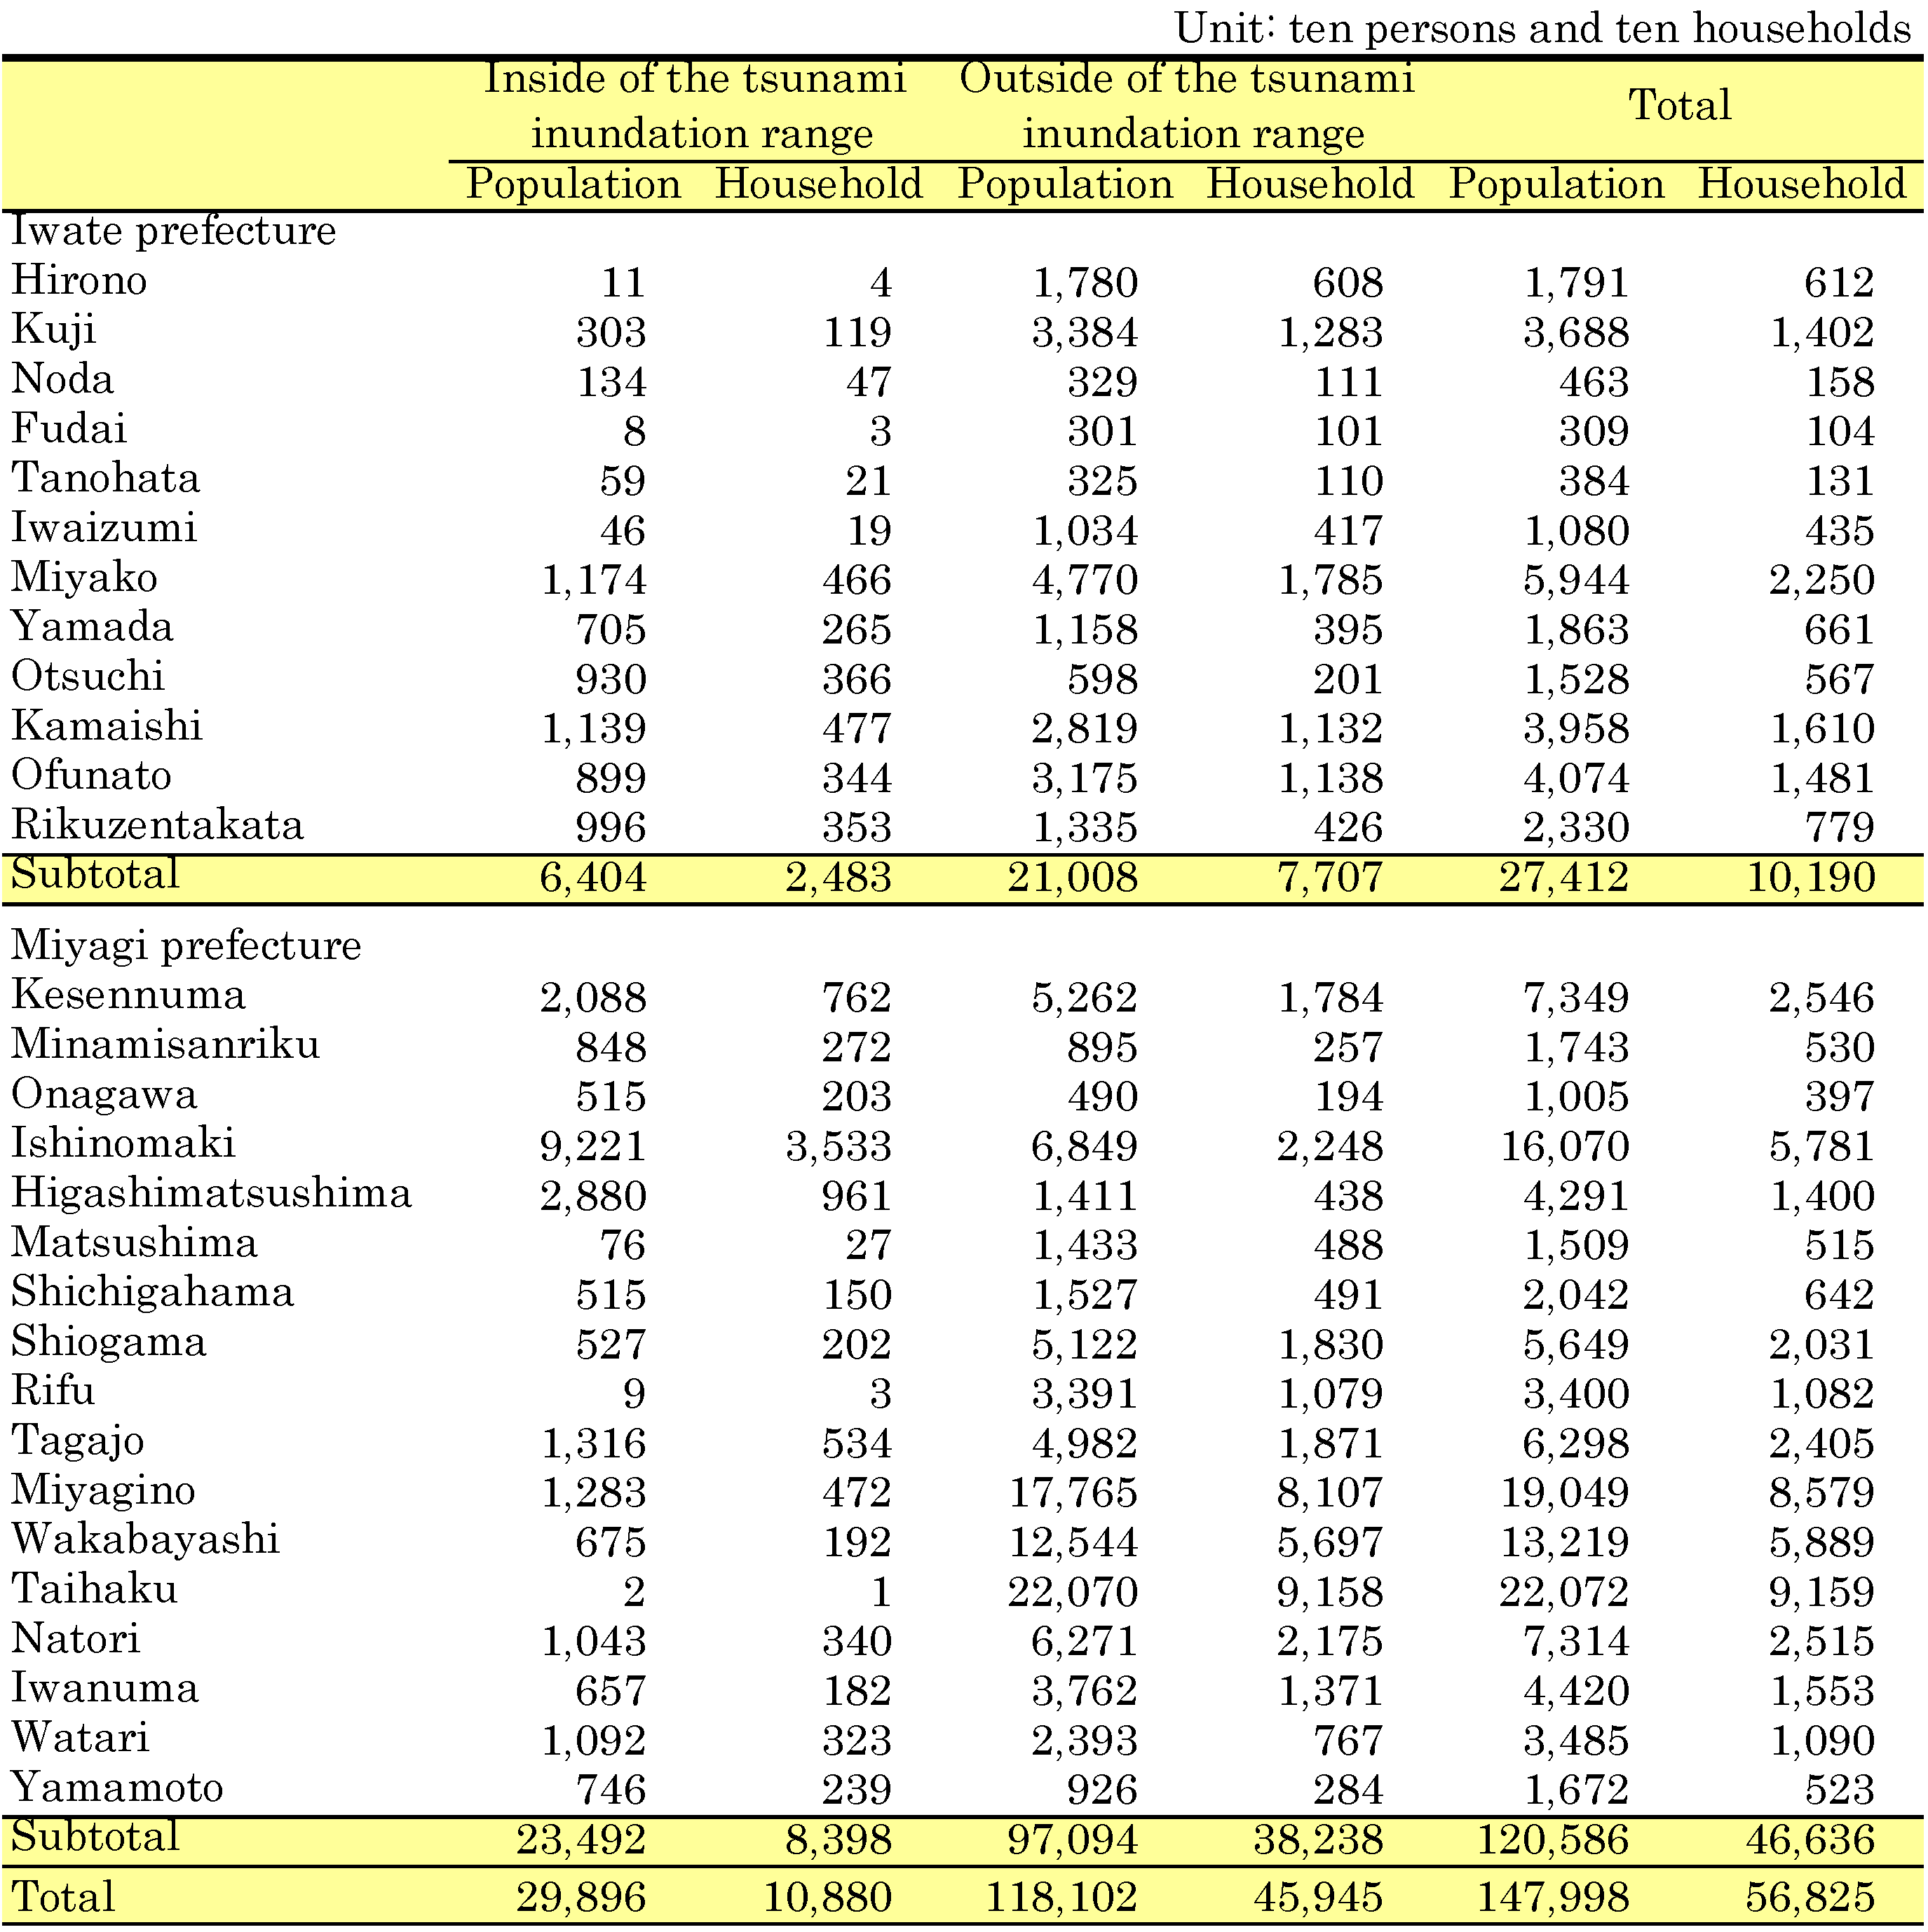 |
| Produced based on population and the number of households from the 2010 Population Census (preliminary figures), and the boundaries of basic unit blocks (census block) under consolidation. |
Figure 1 presents these values for the respective local governments. The bar graphs on the right-hand side show the population and the structure inside and outside of tsunami inundation ranges in each local government area. A population of 5,000-10,000 resides in the tsunami inundation range in many locally governed areas. On the other hand, the population ratio in the tsunami inundation range among all the population varies considerably among these locally governed areas. Local governments exceeding 40% are concentrated along the northern Miyagi coast, with Higashimatsushima heading the list, with 67.1%.
The population density distribution according to basic unit blocks, an index demarcating densely inhabited districts (DID) in the Population Census, is overlaid on the tsunami inundation range in Figure 2 for Higashimatsushima, Ishinomaki, Onagawa, and Minamisanriku in Miyagi prefecture, where the population ratio in the tsunami inundation range is higher. The results reveal that most basic unit blocks with a high population density of 4,000 and more per square kilometer in these local governments were hit by tsunami. The population ratio in the tsunami inundation range is high also in other areas such as Otsuchi and Rikuzentakata in Iwate and Yamamoto in Miyagi.
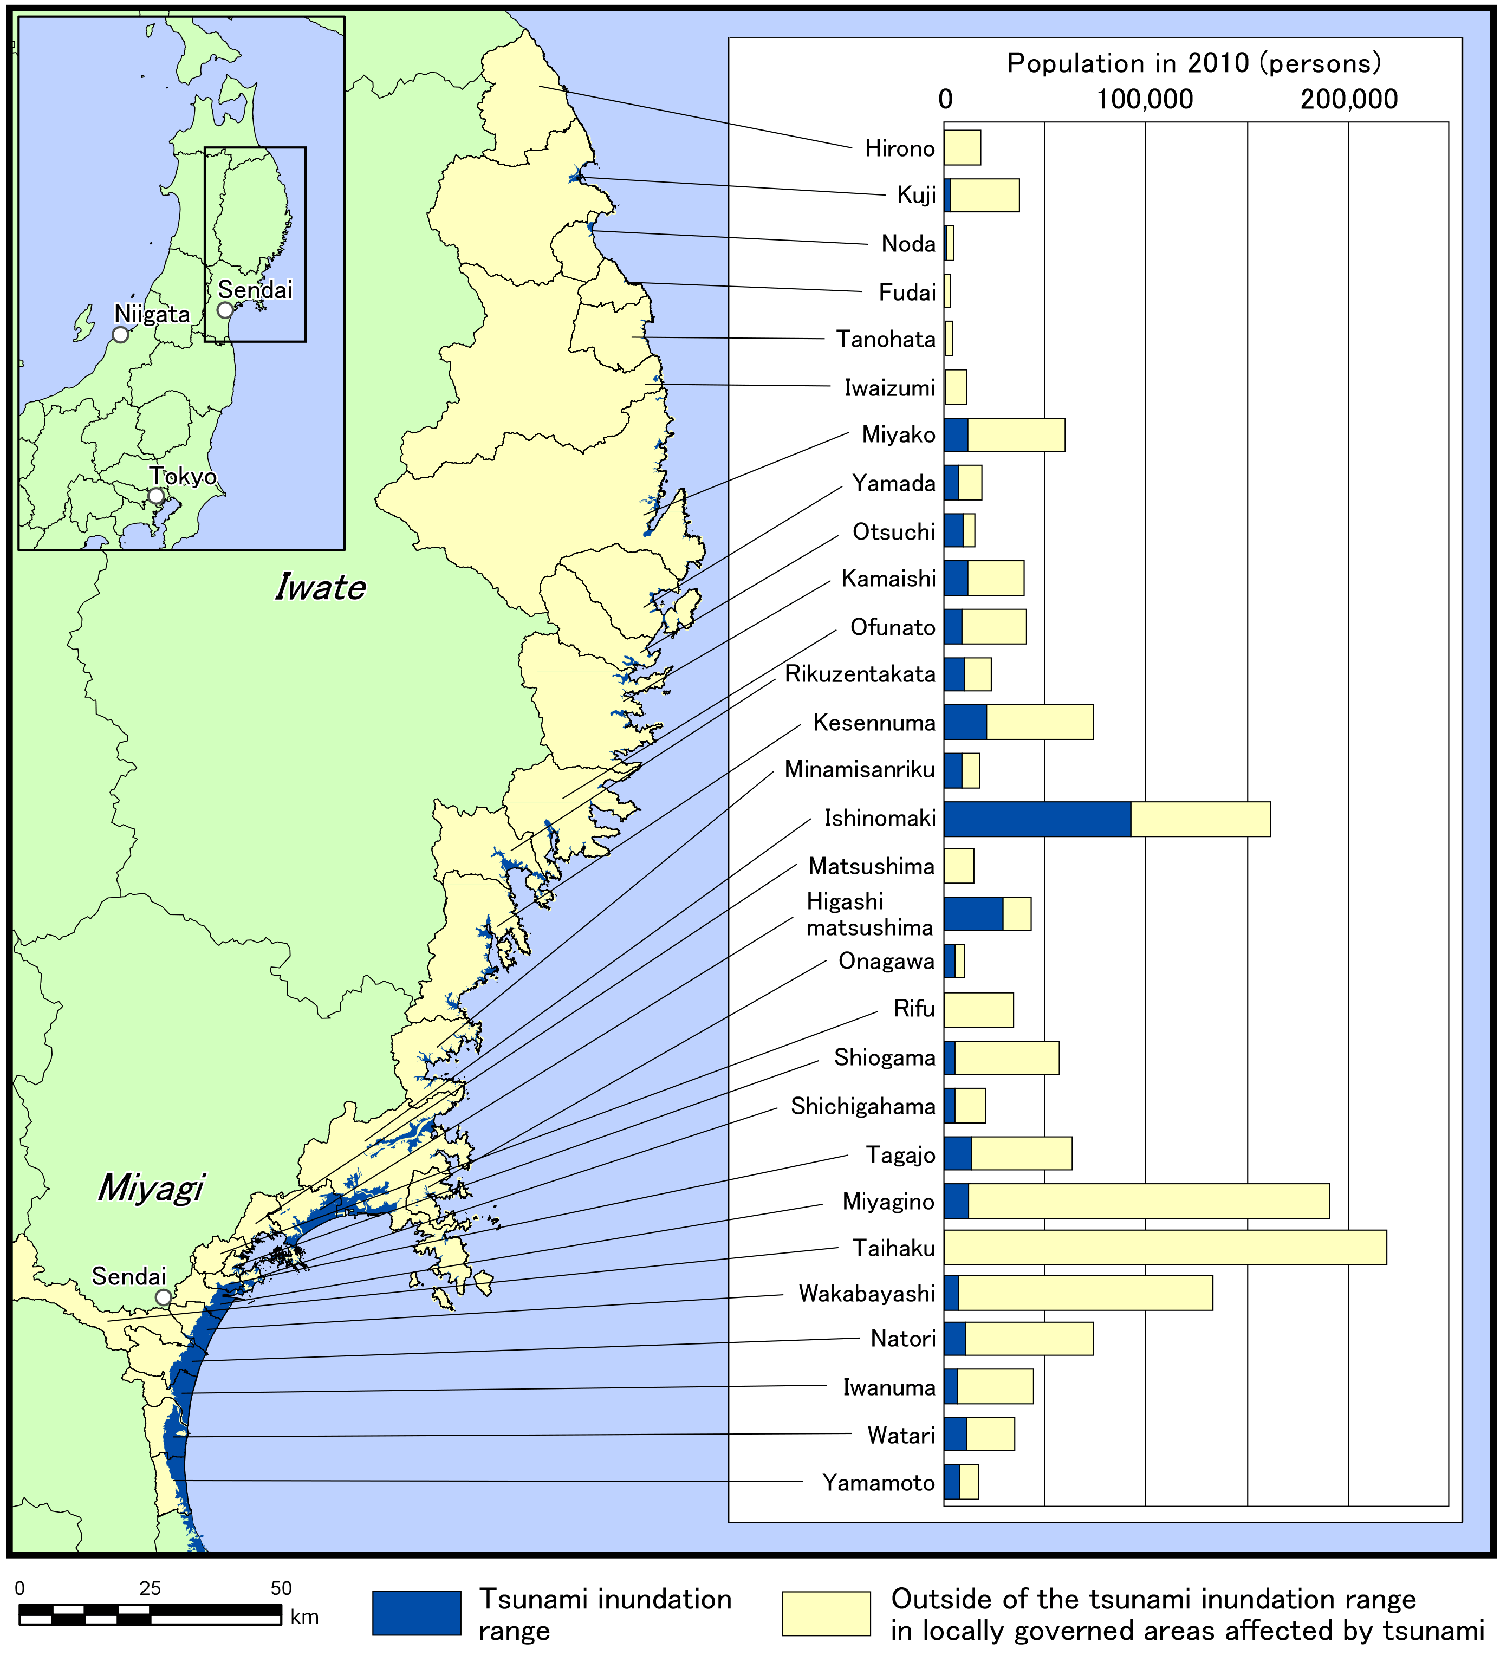 |
| Figure 1. Population in the tsunami inundation range from Sanriku coast to Sendai Bay area for each local government Produced based on population and number of households from the 2010 Population Census (preliminary figures), and the boundaries of basic unit blocks (census block) under consolidation. |
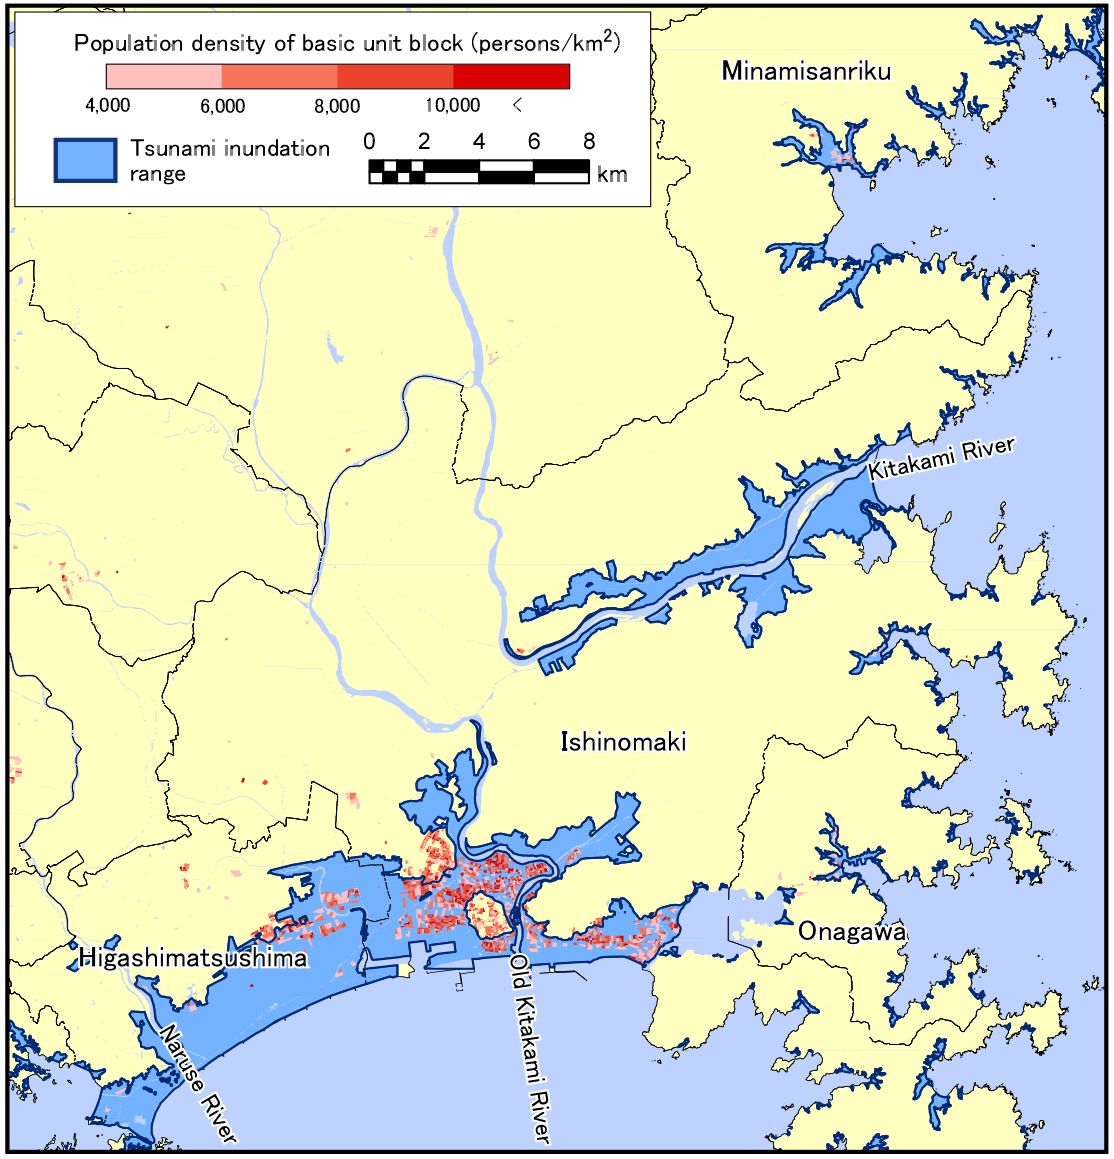 |
| Figure 2. Tsunami inundation range around Ishinomaki, and distribution of densely populated areas Produced based on population and the number of households from the 2010 Population Census (preliminary figures), and the boundaries of basic unit blocks (census block) under consolidation. |
The population in the tsunami inundation range estimated in the present work does not necessarily represent the decrease of population that was actually suffered. Furthermore, the extent of the calamity cannot be discussed because tsunami height distribution data are unavailable. Nevertheless, information related to the prior population of areas that were influenced by the tsunami is important as basic data to support restoration plans. Particularly, local governments with a high population ratio in the tsunami inundation range must reconsider the previous structure of the city and community when producing restoration plans.
Notes
| Proportional division processing of population (unit: person) | |
 |
 |
| Case of Procedure a | Case of Procedure b |