
Fukushima Hamadori Diaspora
age and sex of evacuees from the nuclear crisis
The 2011 East Japan Earthquake Bulletin of the Tohoku Geographical Association
26 April, 2011
Yuzuru ISODA, Associate Professor, Tohoku University
Email: isoda(a)m.tohoku.ac.jp
Local authorities without locale, households without home
While the progress (or un-progress) of the damaged Fukushima I Nuclear Power Station is well televised, the overall picture on how evacuees from the vicinity of the Nuclear Power Station are coping with the crisis is hard to grasp. The region suffered from the earthquake, tsunami and the radioactive leak all in one set, followed by Evacuation Orders to regions within 20 km of the Fukushima I NPS (and 10 km of the Fukushima II NPS), and Remain Indoors Instruction to region 20-30 km from the Fukushima I NPS. Most population in the Evacuation Order zone evacuated, and many more did so voluntarily from the Remain Indoors Instruction zone as commerce and logistics came to a halt including the provision of relief supplies. The Remain Indoors Instruction was switched to Voluntary Evacuation Recommendation on 25 March, creating potentially 70-128 thousand refugees (the numbers are the 2005 population within 20km and 30km from the NPS, respectively, from Tani, 2011), although the exact number of evacuees is not yet captured by the local authorities.This article tabulates the List of Evacuees publicized by Fukushima Prefecture (as of 15 April), by municipality of their usual address, by evacuation destination and by sex and age to examine the situations of the evacuees. The List only covers the evacuees in institutional evacuation facilities and is an inaccurate source because departure from the evacuation center is not fully recorded and there can be double counts of evacuees as s/he moves from one place to another. Nevertheless, the list is almost the sole source to examine the geographical spread of the evacuees.
The List contains 80,870 records of which 66,987 from Fukushima Prefecture are not known to have left the evacuation facilities. The list does not tell fully about those who left the facilities but notes written to some records tell that some moved to other evacuation facility, went back home, hospitalized, or adopted by families and relatives therefore many of those who left seem to be still under evacuation in private setting. The remaining evacuees are tabulated by municipality of the usual address and mapped in figure 1.

|
| Fig 1. Evacuees by municipalities in Fukushima |
Evacuees' origins and destinations
Although Fukushima has become a household name for nuclear contamination internationally, the region directly affected by the nuclear crisis is the Hamadori region along the coast, separated by Abukuma Mountains from the more populous Nakadori region. The largest number of evacuees comes from MinamiSoma City (19,052 persons) and Iwaki City (14,735), at the northern and southern end of the 30 km radius zone, respectively. The two cities, despite being hit by tsunami and having considerable number of population outside of Evacuation Order zone, suffered severe lack of resources and help from other regions which lead to now renowned YouTube speech by Katsunobu Sakurai, the mayor of MinamiSoma City. Fukushima I NPS is located in Futaba Gun (or county) or more specifically at Okuma-cho at the northern border to Futaba-cho. The next largest numbers of evacuees come from 8 municipalities in Futaba Gun where most parts are within 30 km radius from the Fukushima I NPS. The municipal function of these 8 municipalities are moved to municipalities in Nakadori region, as almost entire population evacuated from the area.In terms of rates per population, municipalities in Futaba Gun have the highest rates because of the Order and the Instructions, for example 57% for Okuma-cho, but such rates only indicate the coverage of the List. The rate for Futaba-cho, immediately north of NPS is extremely low (17.6%), probably because the residents who have seen the explosion and heard the blast have evacuated early through private means.
Figure 1 also shows whether the evacuees are evacuating within their own municipality. Evacuees from municipalities under Evacuation Order are evacuating entirely to other municipalities for obvious reason, but near 100% evacuation to other municipalities can be found in surrounding municipalities including Fukushima City (336 persons) and Koriyama City (464 persons), the two largest cities in Fukushima Prefecture. These cases seem to be preventive voluntary evacuees in fear of radioactive leak. The evacuees outside of their own municipality can be regarded as evacuation caused by nuclear crisis, because other evacuees would likely to stay near home for restoration activities (this does not apply to the situation in tsunami-hit Sanriku ria coast, as the coast have very little safe flat land and thus considerable proportions of citizens had to evacuate to neighboring municipalities). There are 50,975 individuals from Fukushima Prefecture who are evacuating outside their own municipalities and their whereabouts are analyzed in the rest of the analysis.
 |
 |
| (a) by prefecture | (b) by municipality |
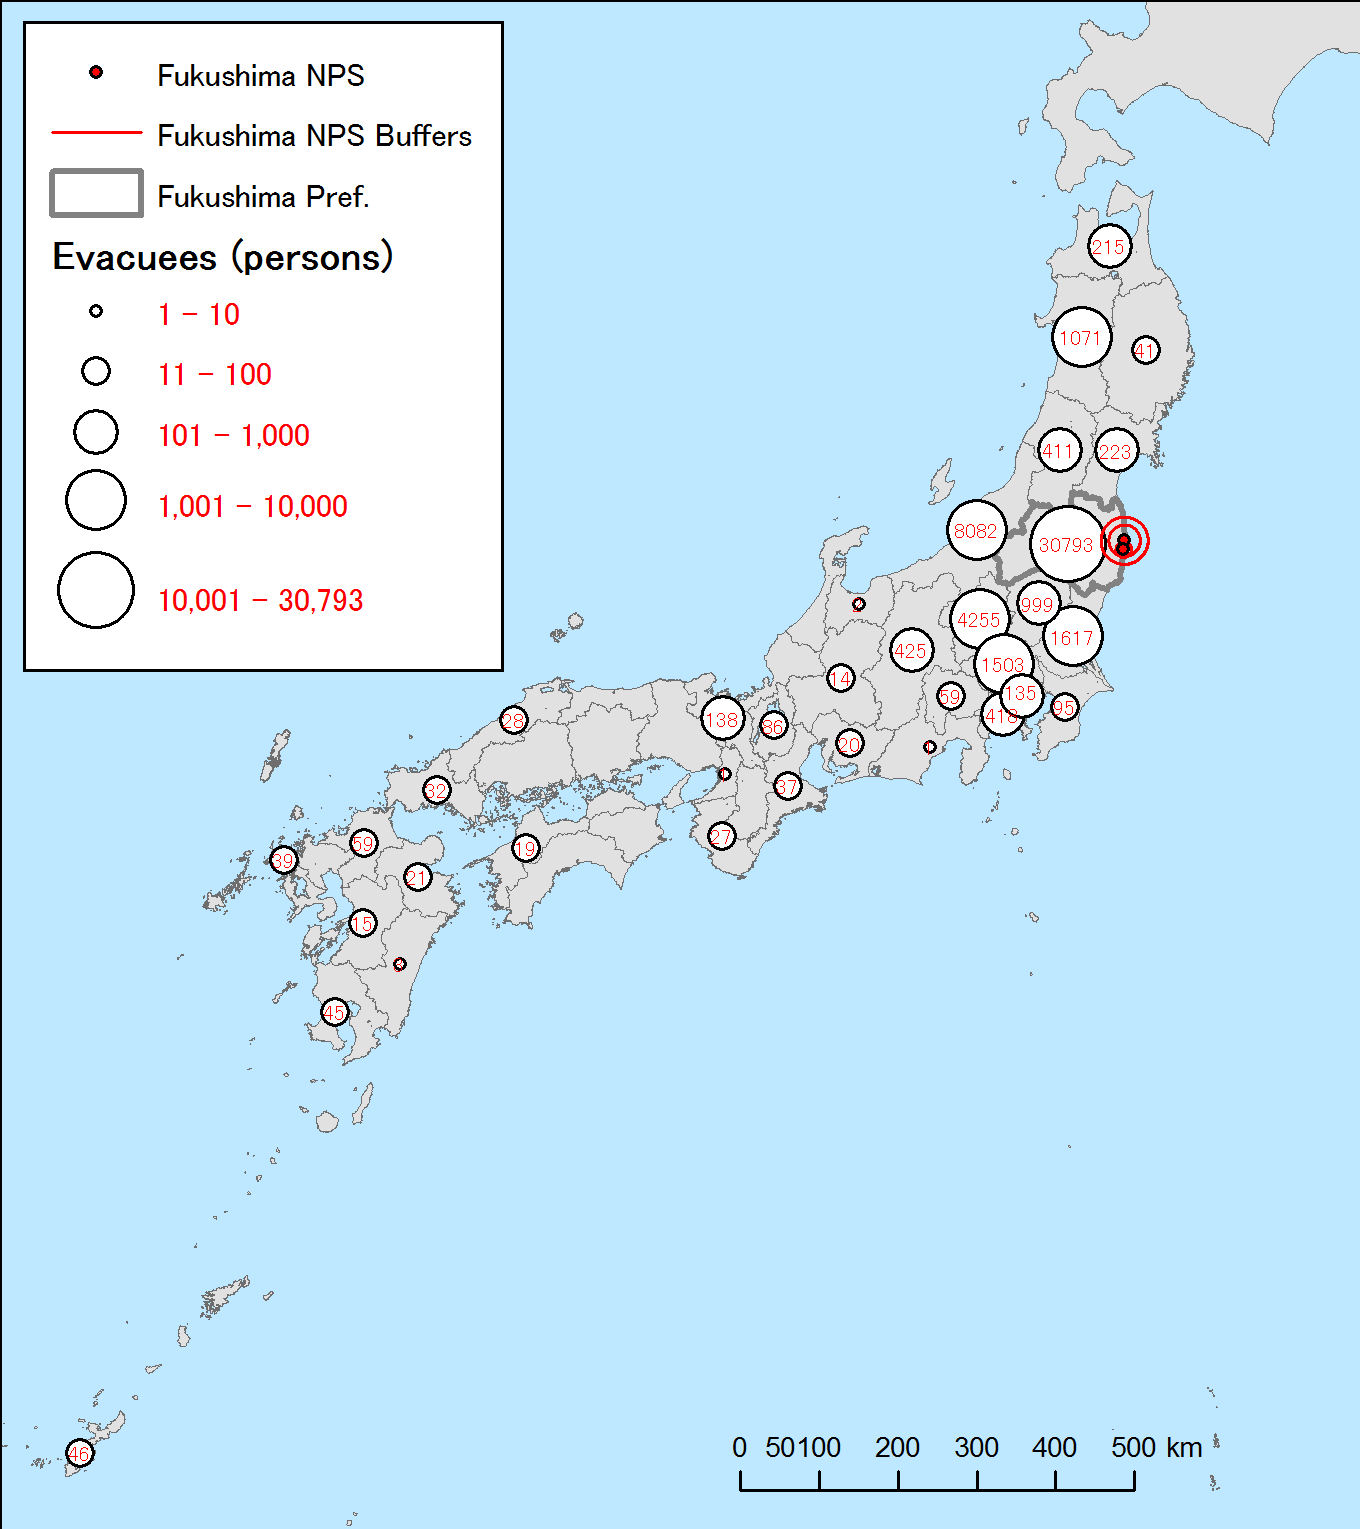
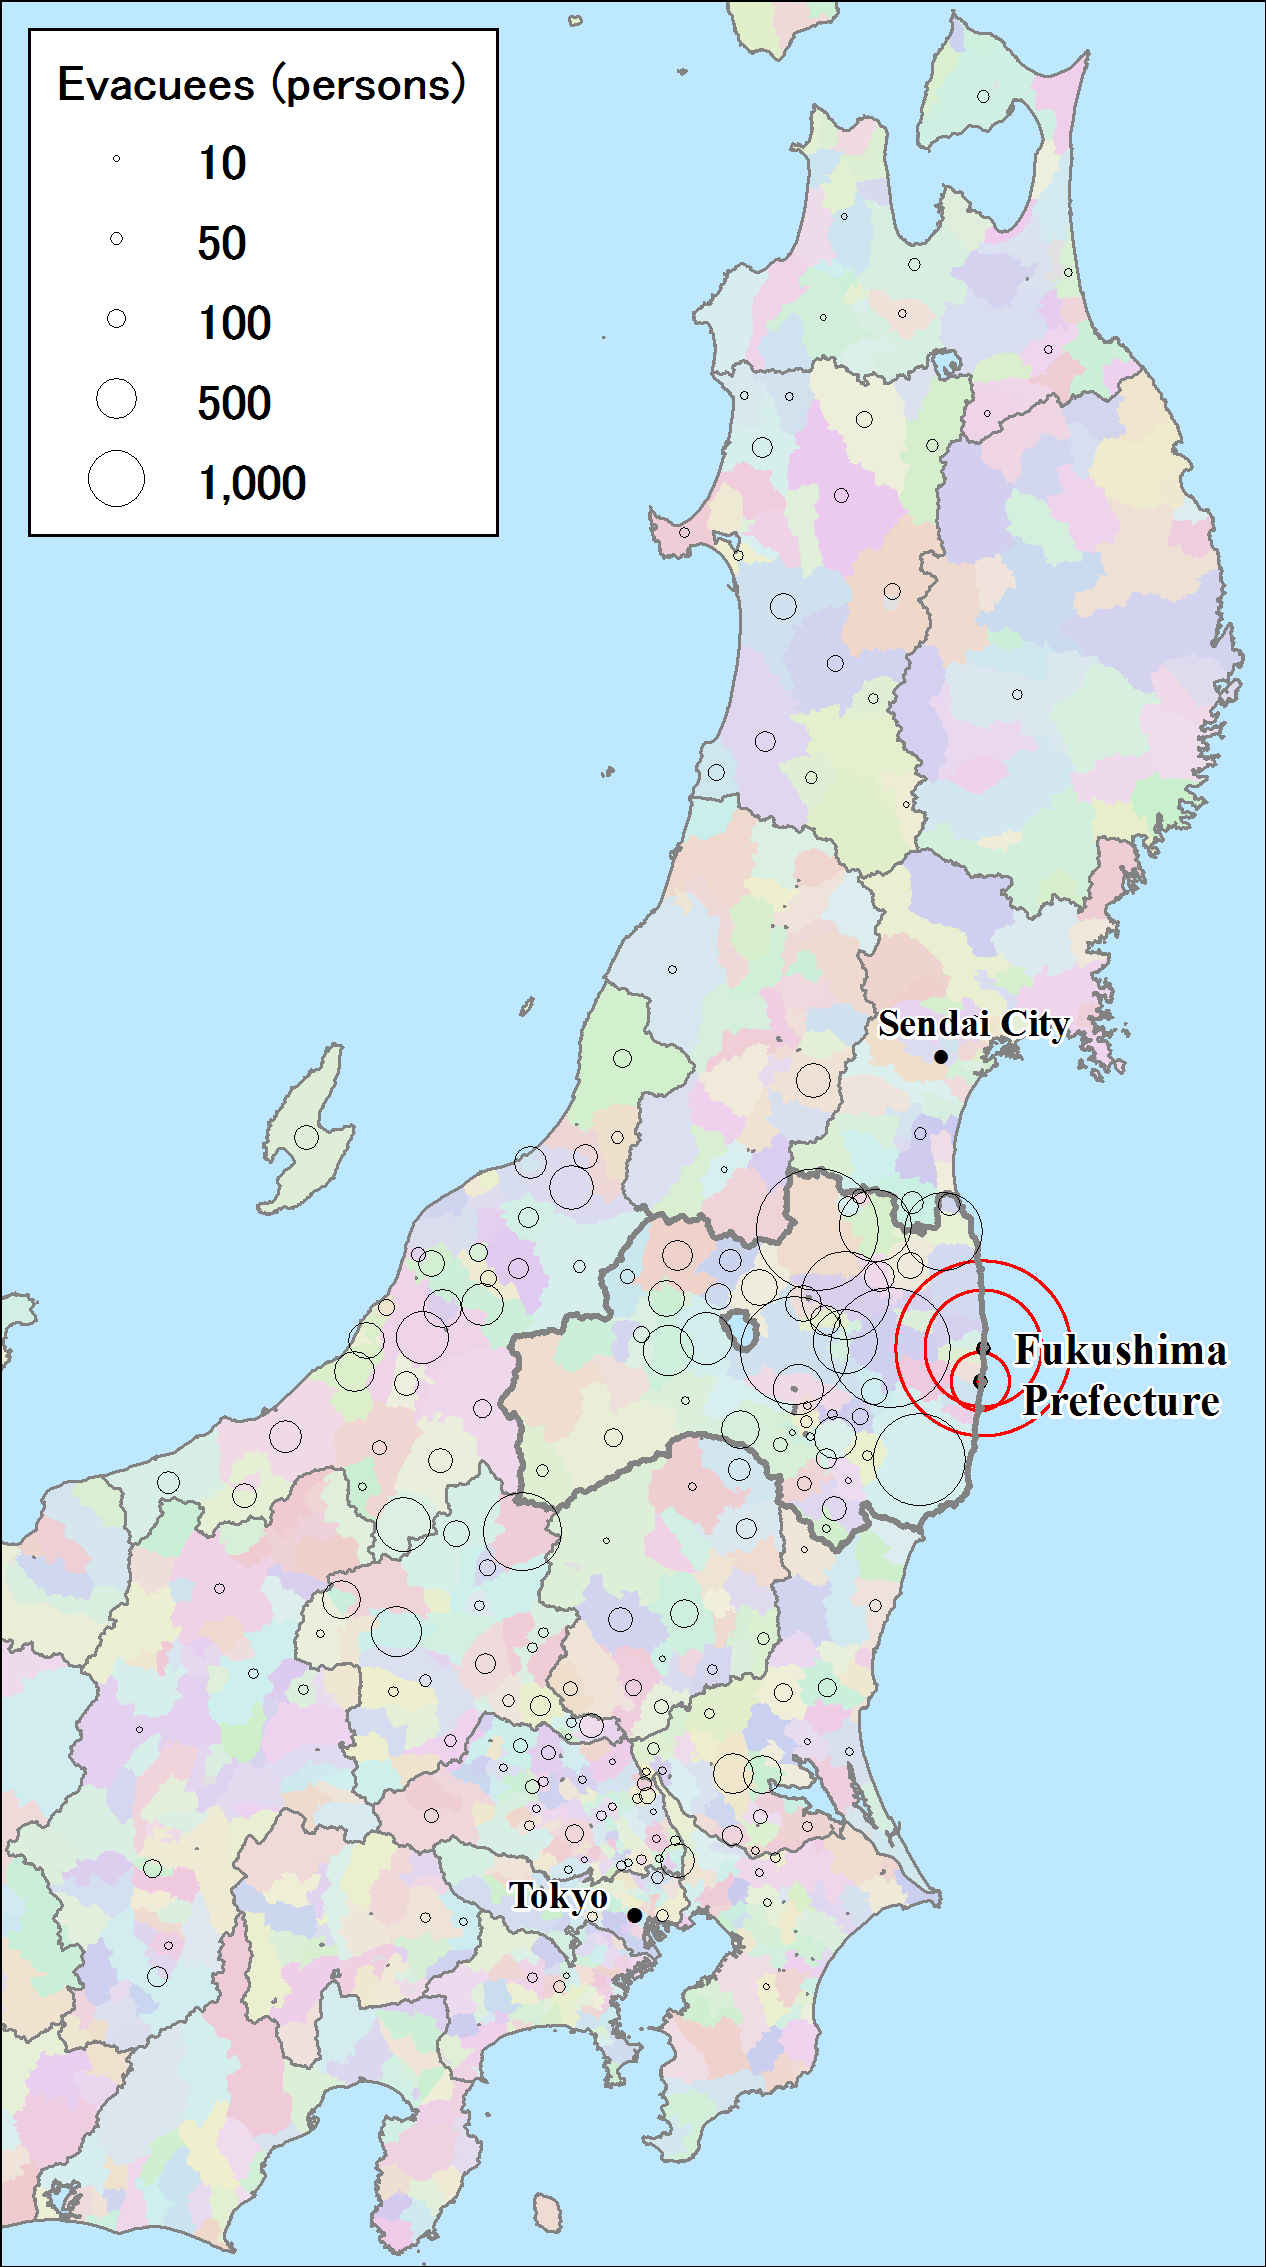
| Fig 2. Evacuee destinations from Fukushima (those outside their own municipality) | |
Of 50,975 individuals from Fukushima Prefecture evacuating outside their own municipality, 20,182 (39.6%) are evacuating outside Fukushima Prefecture; to Nigata Prefecture (15.9%) and Gunma Prefecture (8.3%) followed by Ibaragi, Saitama, Akita and Tochigi Prefectures (2-3% each) (Figure 2a). Note again that these figures based only on records covered in the list and a lot more seem to have evacuated privately outside prefecture. Inquiries of Fukushima Prefecture to all other prefectures confirmed 29,833 evacuees in all prefectures in Japan (Asahi.com, 19 April, 2011). Largest acceptances of evacuees outside their own municipality are, Fukushima City (4,773), Tamura City (4,621), Koriyama City (3,713), Iwaki City (2,657), Nihonmatsu City (2,449), all in Fukushima Prefecture. Outside Fukushima Prefecture, largest acceptances are Katashina-mura (1,959) in Gunma Prefecture followed by Yuzawa-cho (935), Nagaoka City (877) and Nigata City (869) in Nigata Prefecture.
Evacuees' Attributes
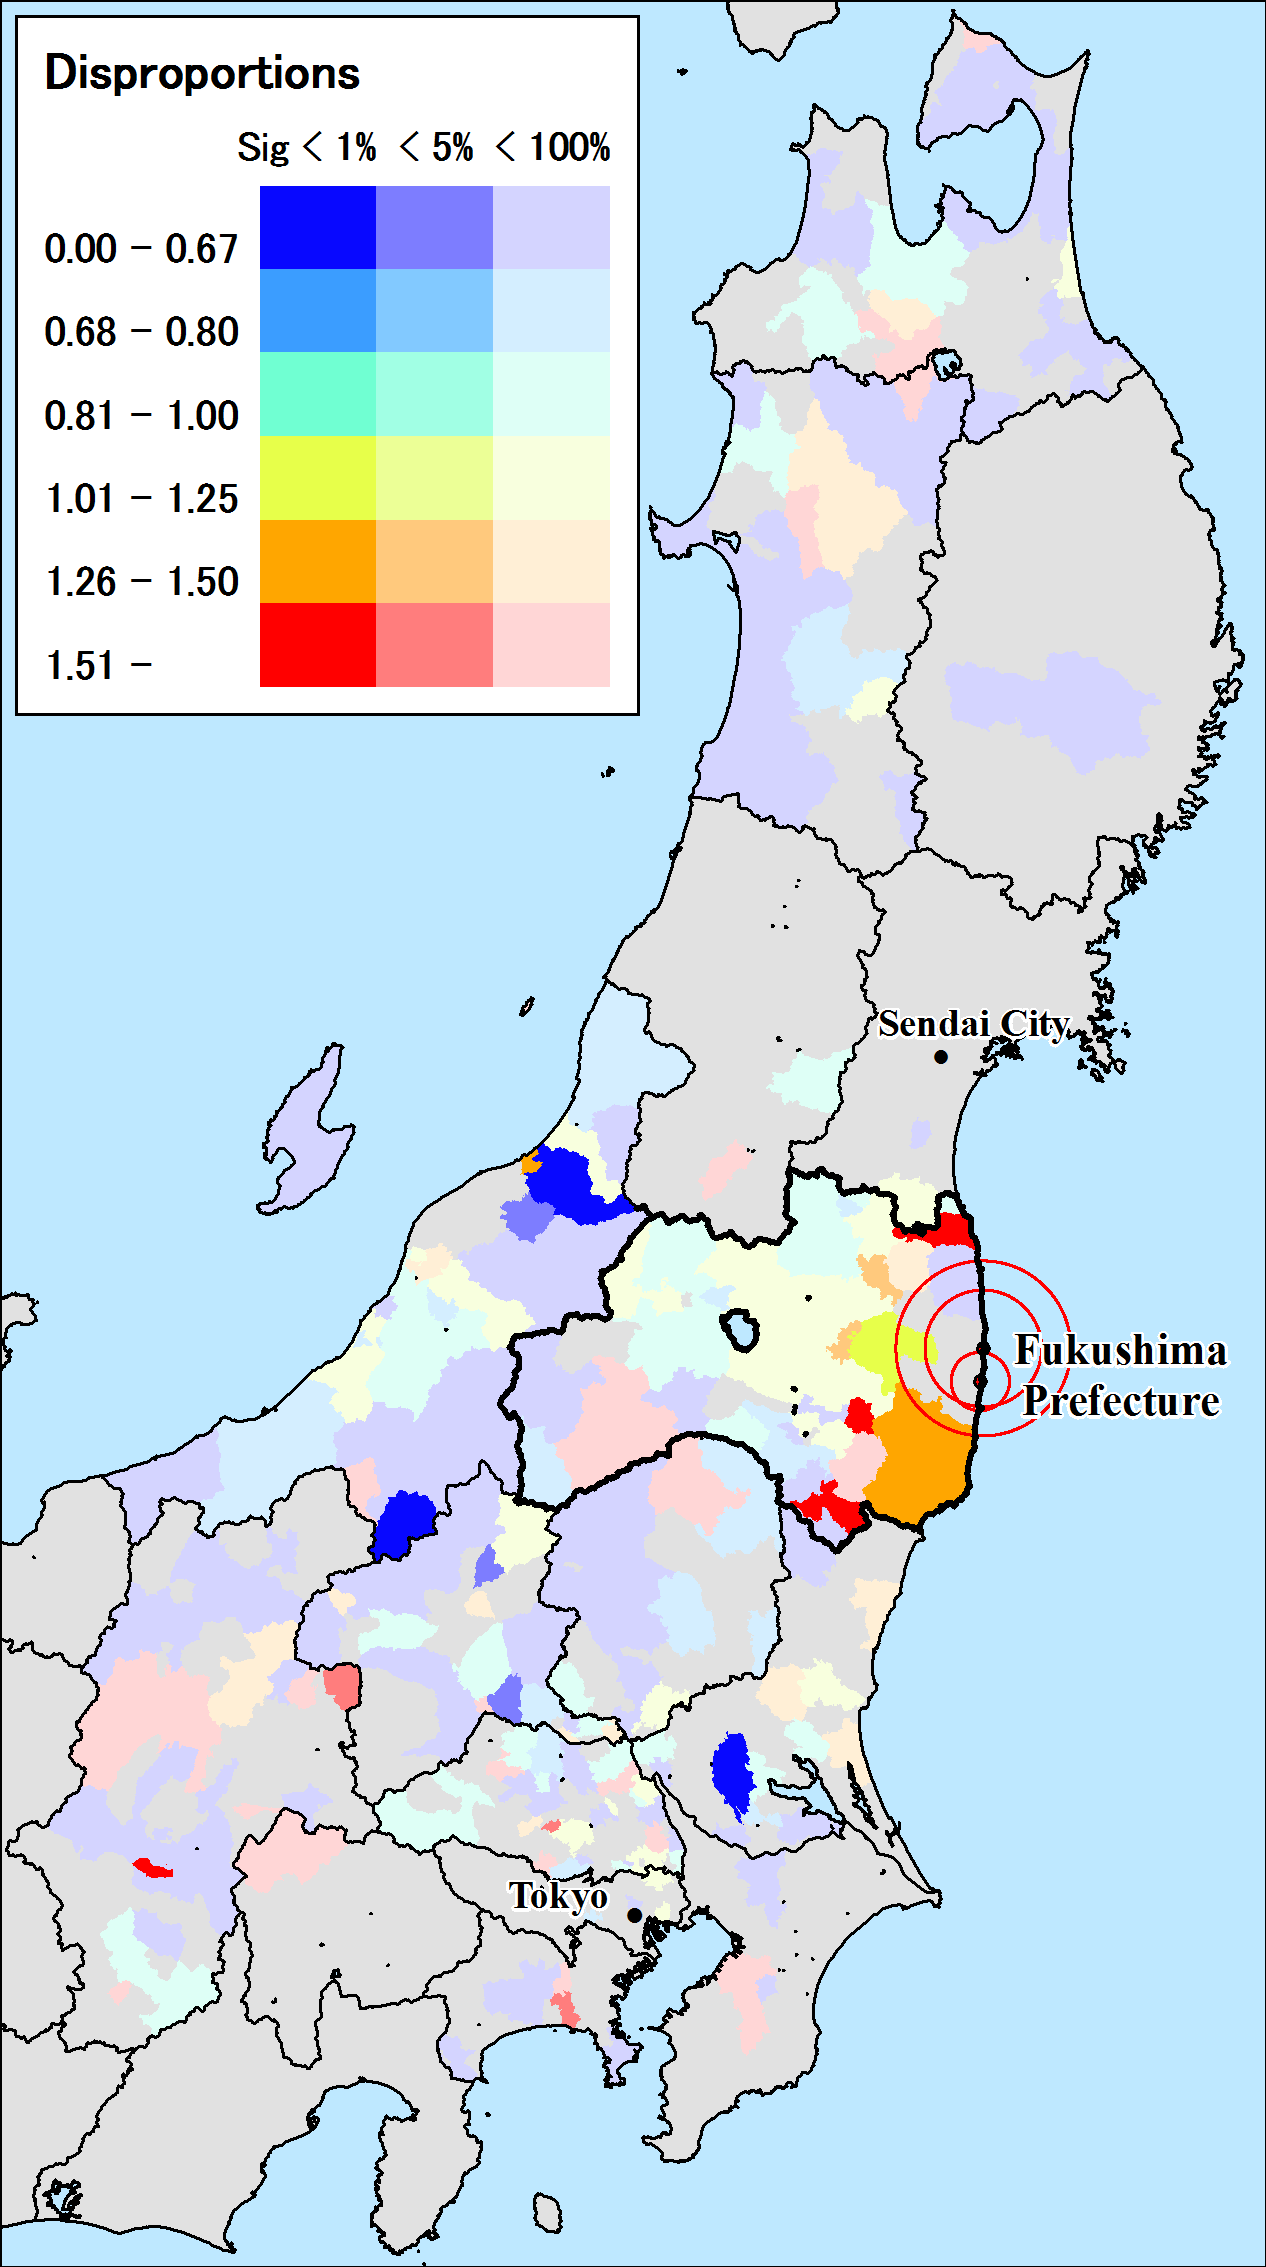
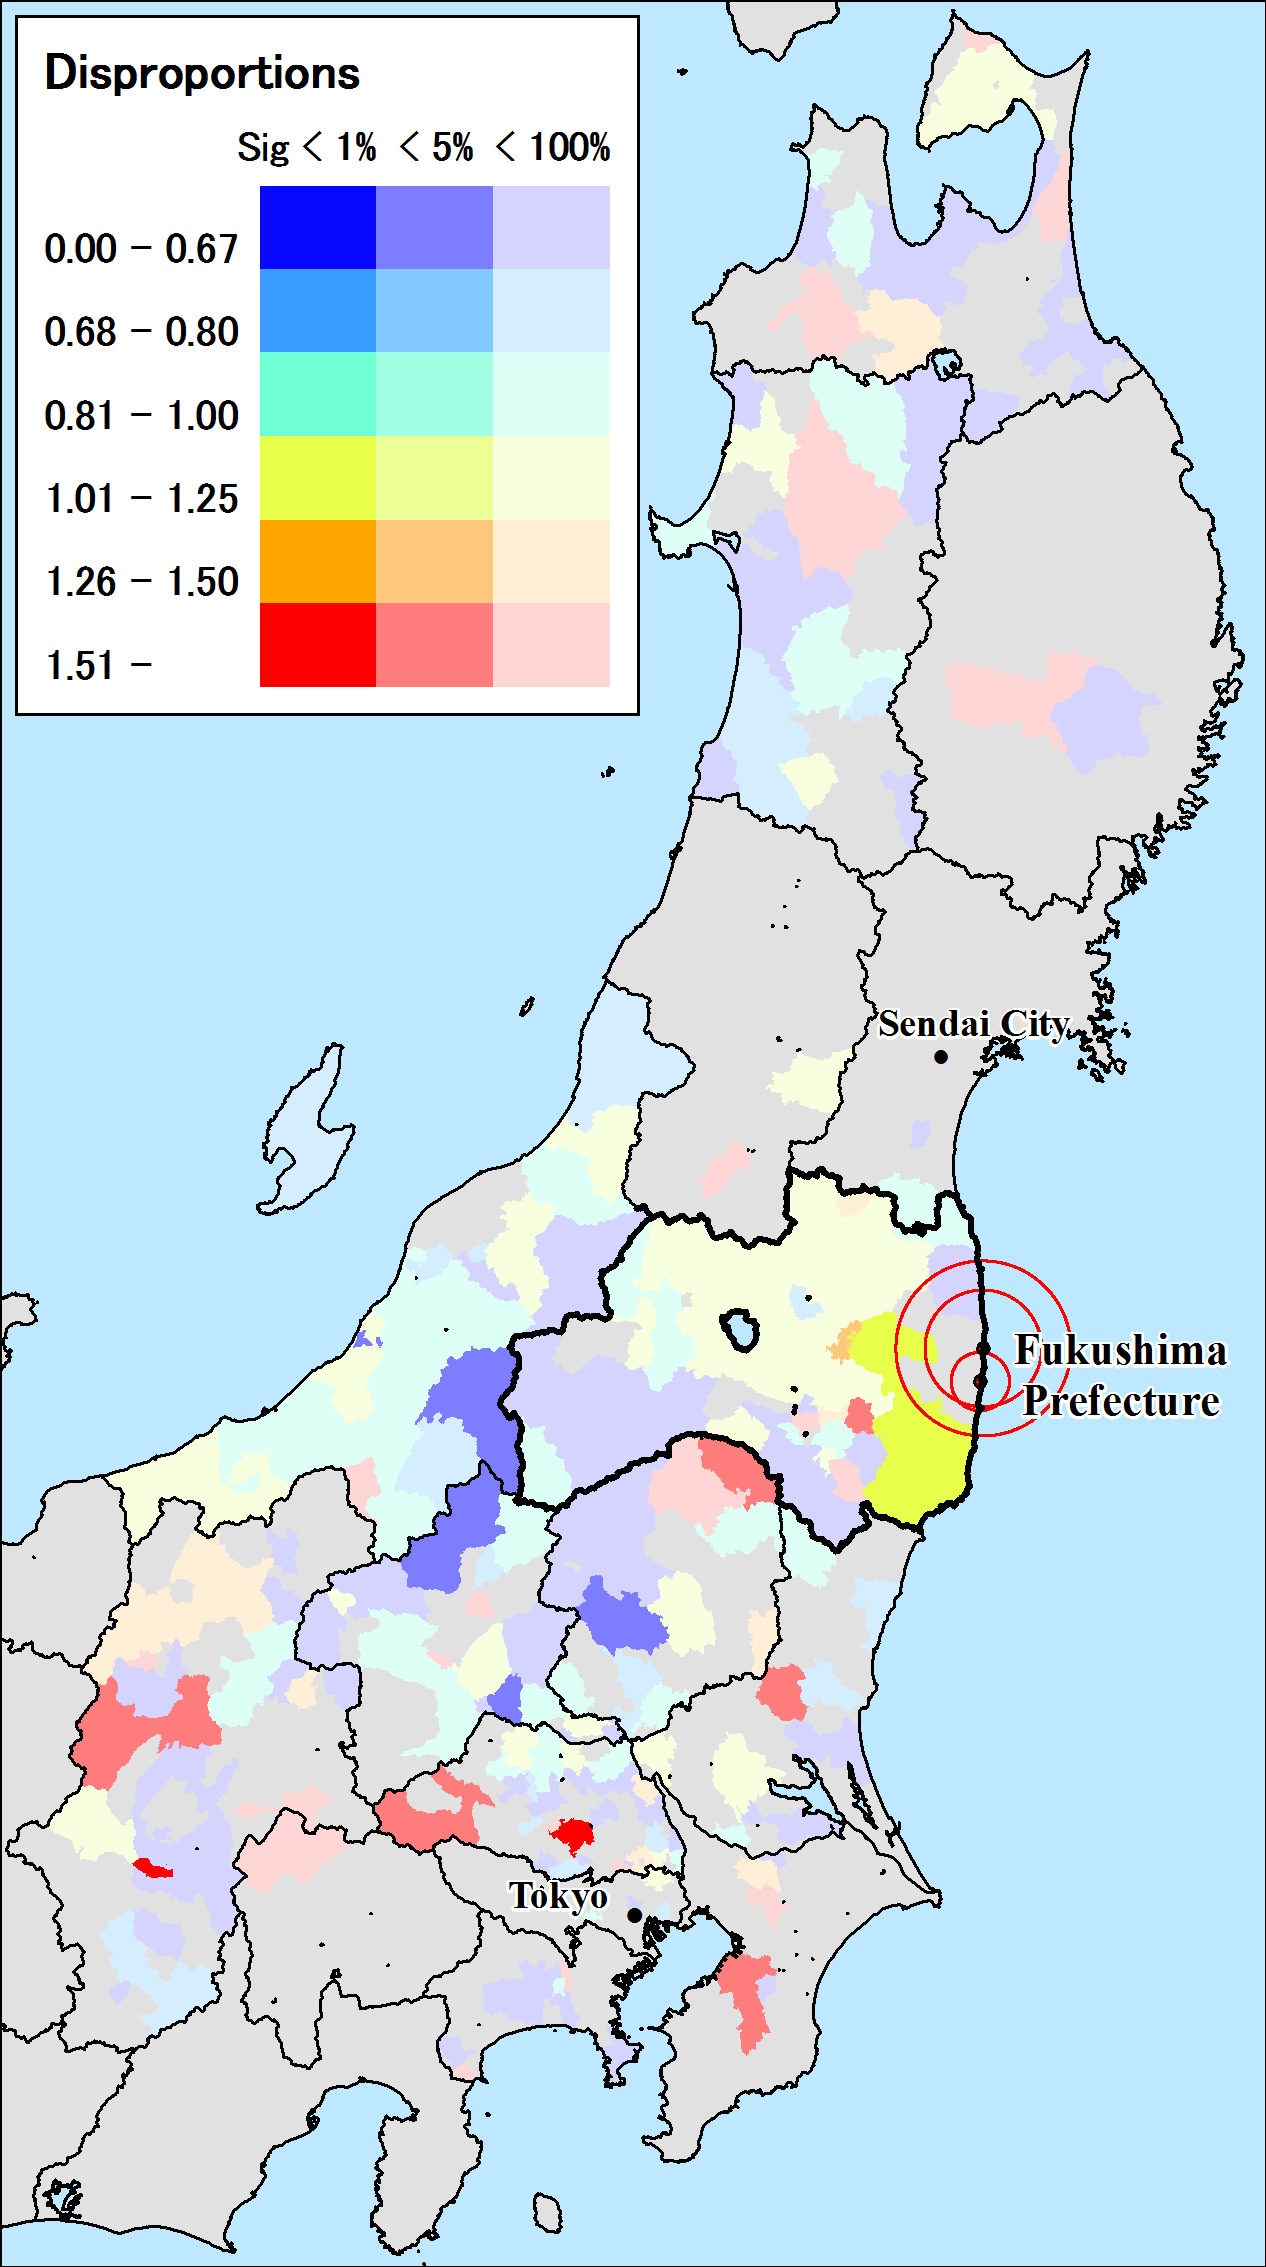
The motivation for writing this article was to know how families under Evacuation Order and Voluntary Evacuation Recommendation are coping with the sudden crisis. There seem to be different strategy to survive this crisis through the choice of evacuation facilities in different locations (though the author is not knowledgeable on how evacuees are allocated to each evacuation facilities). All sorts of facilities are used for evacuation; from the more usual school gymnasium and athletic arena to public meeting facilities, public and private hotels, business hotels and even public housing. Generally speaking, evacuation facilities near home is in poor condition of high congestion and shortage of food, water and heating (at least until infrastructures were restored) whereas distant facilities offers better condition for privacy and hygiene. So the evacuees face trade-off between better living condition on one hand, and nearness to home, being together with neighbors and co-workers, better access to announcements and opportunities from the municipality on the other.What can be imagined are that elderly who are physically frail or in need of healthcare and families with children having more desire for safe condition move to distant locations. Young workers might also opt for seeking jobs in large cities assuming that crisis would persist for long time. To examine these, sex and age composition of evacuees in each locations are analyzed using a method similar to my earlier article in this Bulletin. A proportion of evacuees having an attribute in a location is standardized by the proportion of evacuees having the same attribute in all locations (less location in question, to be more precise), calling this a 'disproportion' of an attribute. A disproportion value of 1 means that the proportion of an attribute in an location is the same with overall proportion of that attribute; value more than 1, say 1.5 means that the proportion the attribute is 1.5 times greater; and a value less than 1, say 0.66…(=1/1.5) means that the proportion of that attribute is 2/3 of the overall proportion. This 'disproportion' value for selected age and sex combination is mapped in figures 3-8. Since the number of evacuees could be small in each location, level of statistical significance is also indicated by the vividness of the colors.
 |
 |
| Fig 3. Ages 0-14 | Fig 4. Ages 15-29 |
For children aged 0-14, exodus from Hamadori region is evident (Fig 3), probably reflecting their parents' concern over the radioactive effect and difficulty of keeping children in congested evacuation centers. Underrepresentation of youth aged 15-29 in Fukushima is not as evident (Fig 4).
 |
 |
| (a) males | (b) females |
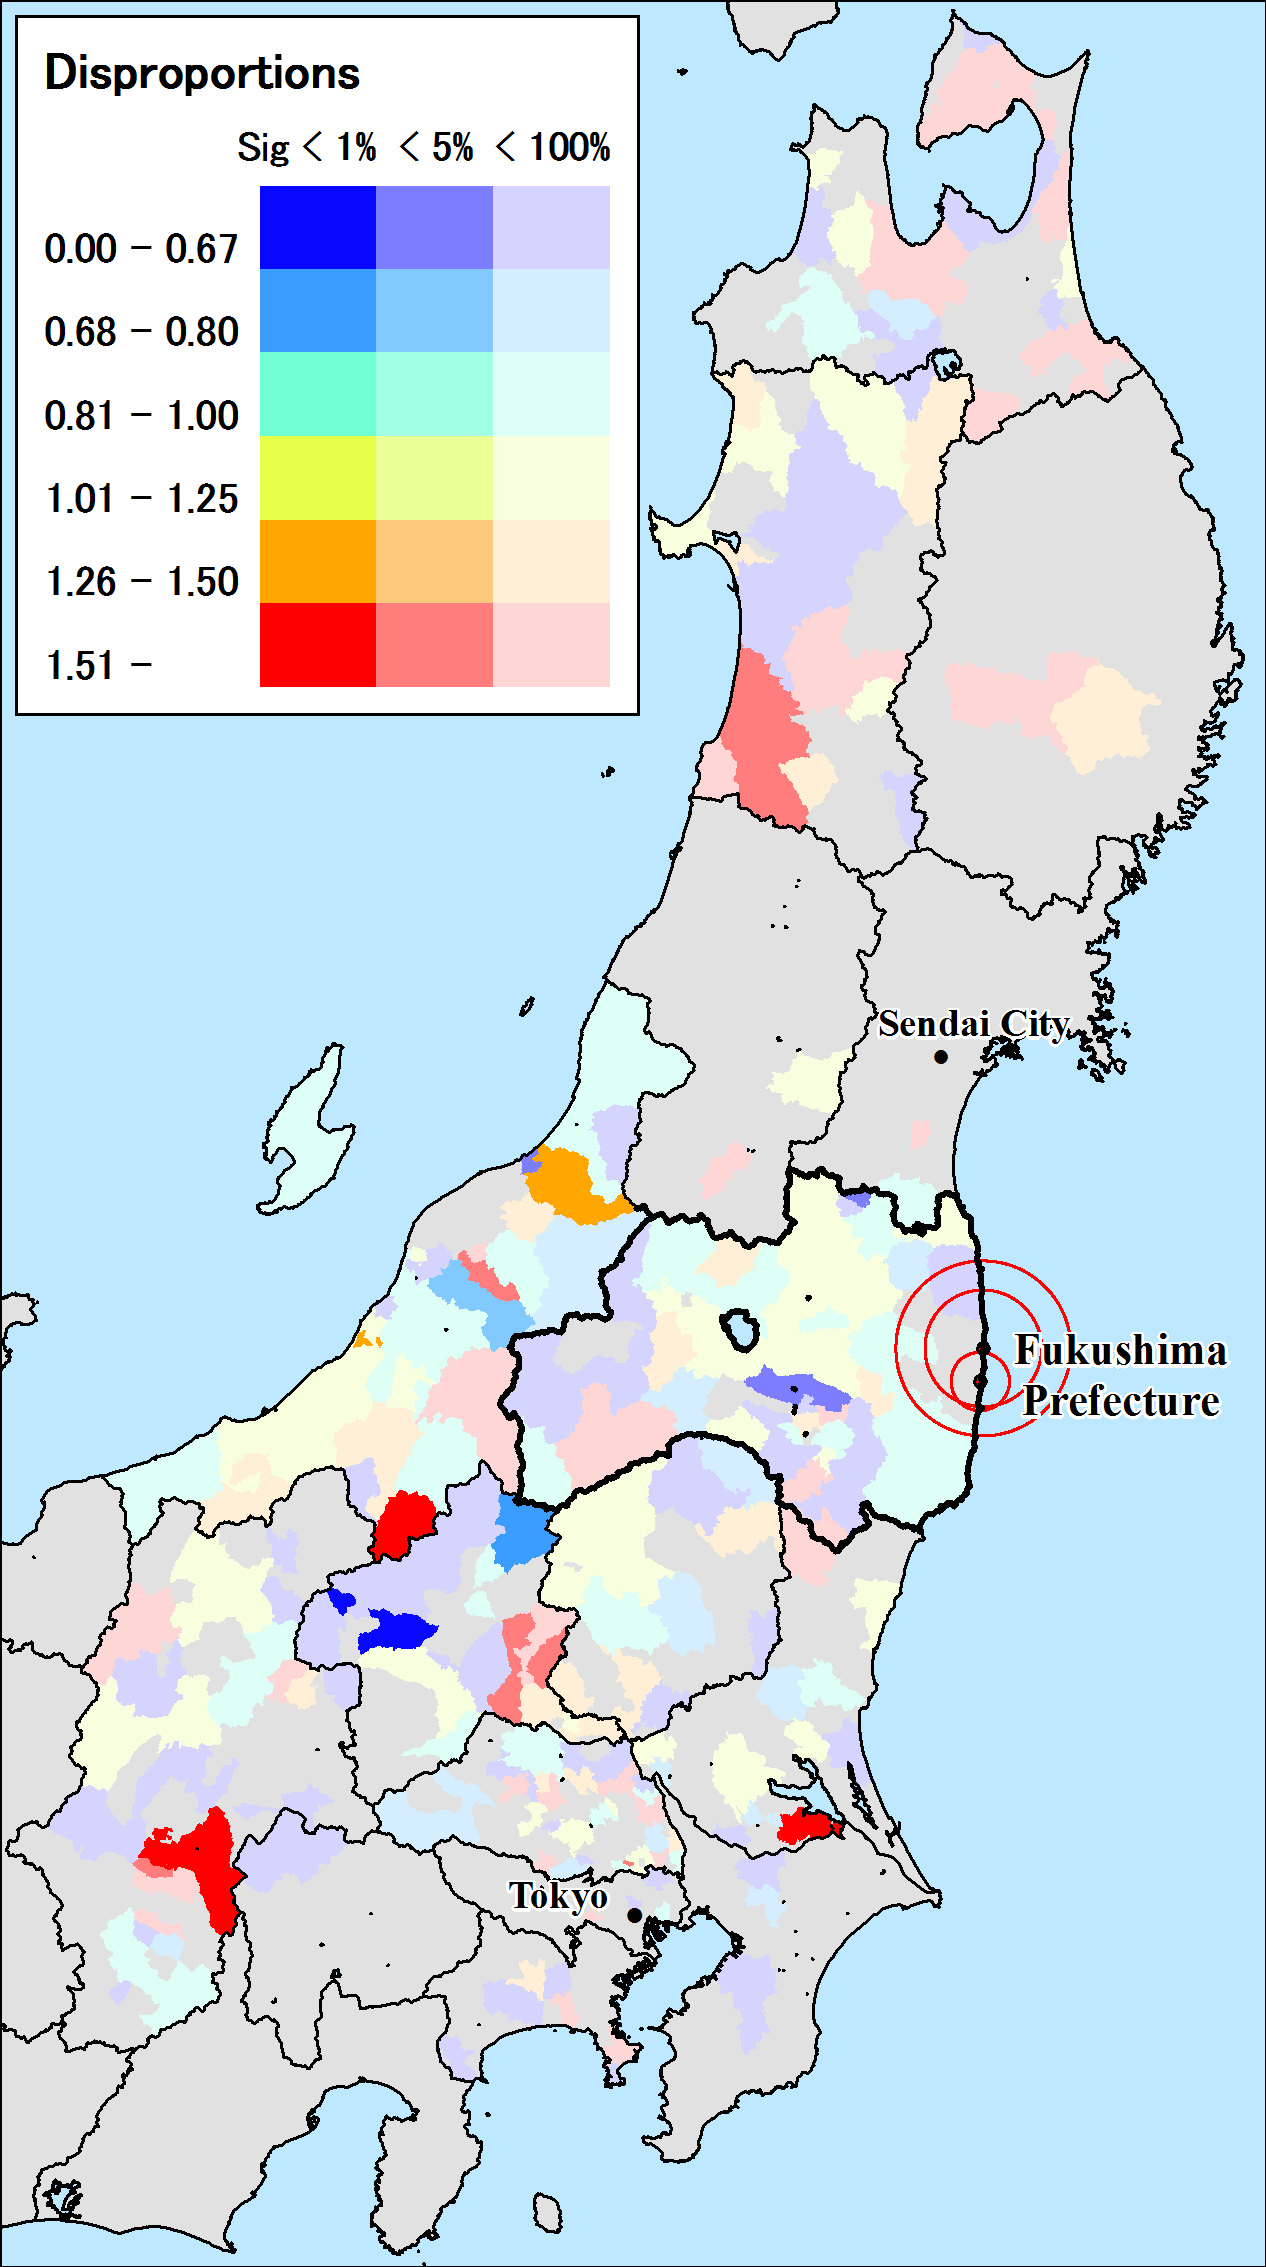
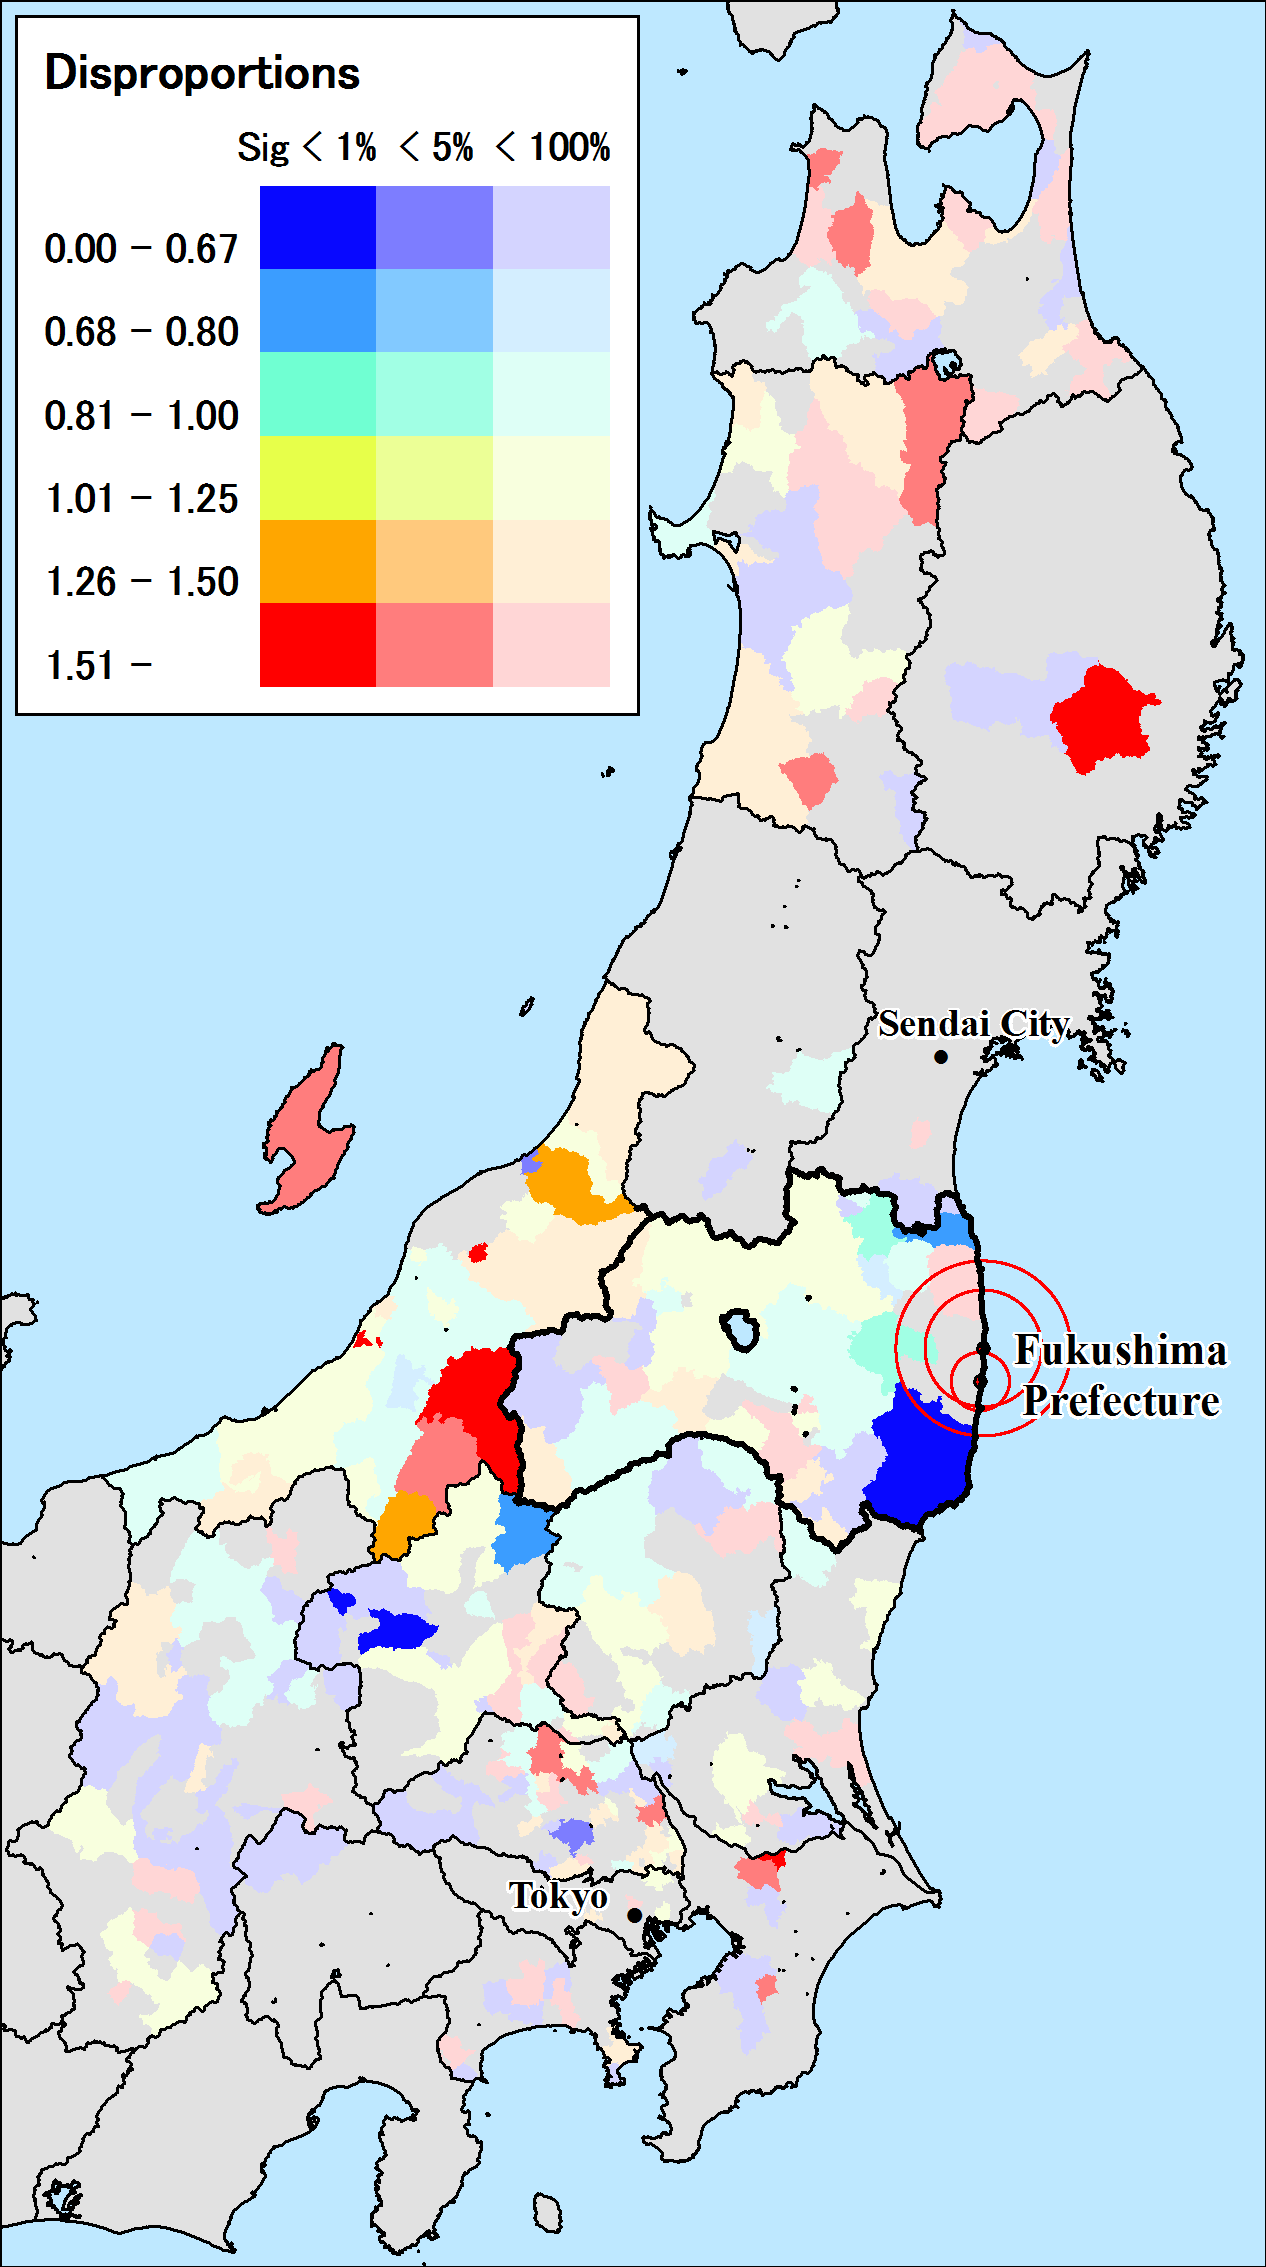
| Fig 5. Ages 30-44 | |
Demographically speaking, ages 30-44 is the parental age of children aged 0-14, and the spatial distribution of this age group should resemble that of children. That seems to be true for females to some extent but not for males (Fig 5), suggesting cases of mothers accompanying children to evacuate to distant locations leaving fathers near home; the nuclear crisis causing scattering of family members as well.
 |
 |
| (a) males | (b) females |
| Fig 6. Ages 45-59 | |
Remaining in Hamadori region is more prevalent for senior working age group aged 45-59, and this is more so for males (Fig 6). This might be because this age group has more responsibility in the region or because there is less opportunity to make a living in other locations.
 |
 |
| Fig 7. Ages 60-74 | Fig 8. Ages 75+ |
Among the older age groups, early elderly aged 60-74 (Fig 7) and late elderly aged 75 or more (Fig 8) have very different pattern. For ages 60-74, statistically significant under or overrepresentation within Fukushima Prefecture is not prevalent, whereas for ages 75 or more, overrepresentation in Hamadori region is striking, against my initial expectation. Perhaps, a strong 'distance deterrence' set in for the late elderly who does not want to be away from members of the same community. The pattern resembles to that of males aged 45-59, many of which could be sons of the late elderly. The unwillingness to move to distant areas among the late elderly might be the added responsibility of sons aged 45-59, keeping them to stay in the region. I do not have explanation for over and underrepresentation of elderly age groups scattered outside Fukushima Prefecture, there might be cases of friends and neighbors of the same generation applying together to specific locations.
Summary
The maps in figures 3-8 should not be confused with the number of evacuees in each age and sex category, the number should be guessed by total number of evacuees in figure2b. The analysis of age and sex of evacuees revealed that although the largest evacuee destinations in Nakadori region maintains balanced age sex composition, there has been a tendency that children and their mothers evacuate to distant locations outside Fukushima Prefecture and senior working age group (aged 45-59) especially that of male and their parent age group (aged 75 or more) stay in Hamadori region. These tendencies suggest family separation as a strategy to handle trade-off between maintaining the link to the community and to the municipality, and having safe and sound living conditions. There was no clear indication that young workers are flowing to large labor market areas to seek for alternative job. Lastly, this analysis is solely based on the List of Evacuees covering only institutional evacuees, probably half of all the evacuees from the nuclear crisis. Fukushima Prefecture is trying to get access to those evacuated privately and the analysis including them has to wait until better data become available.References
Asahi.com(2011) ' Evacuees outside prefecture from Fukushima, in almost all prefectures' 19 April, 2011 (in Japanese) http://www.asahi.com/national/update/0419/TKY201104190413.htmlTani K. (2011) '2005 Population Map and Population Estimation in Tsunami and Nuclear Crisis Affected Areas' (in Japanese) http://ktgis.net/tohoku_data/tsunami_area_population.html
Copyright(C)2006- The Tohoku Geographical Association