Distribution of Damages within Sendai City:
an inference based on the dead and the evacueesf residential addresses
The 2011 East Japan Earthquake Bulletin of the Tohoku Geographical Association
9 April, 2011
Yuzuru ISODA, Associate Professor, Tohoku University
Email: isoda(a)m.tohoku.ac.jp
Sendai City, the largest city in Tohoku region, has 1.03 million population and is a pivotal place for command and control of the region and of logistics. The city center is on fluvial terraces of Hirose River and densely inhabited residential areas are created on the surrounding hills through land cuts and fills. Farming cultivating rice on paddy fields prevails on alluvial coastal plain. At the time of writing, very little is known about the overall damage to the city; number of missing persons not yet published, number of death not confirmed and inspection of structural damage have hardly began. This article speculates the spatial distribution of impacts to the Sendai City through mapping the usual addresses of the dead and the evacuees.
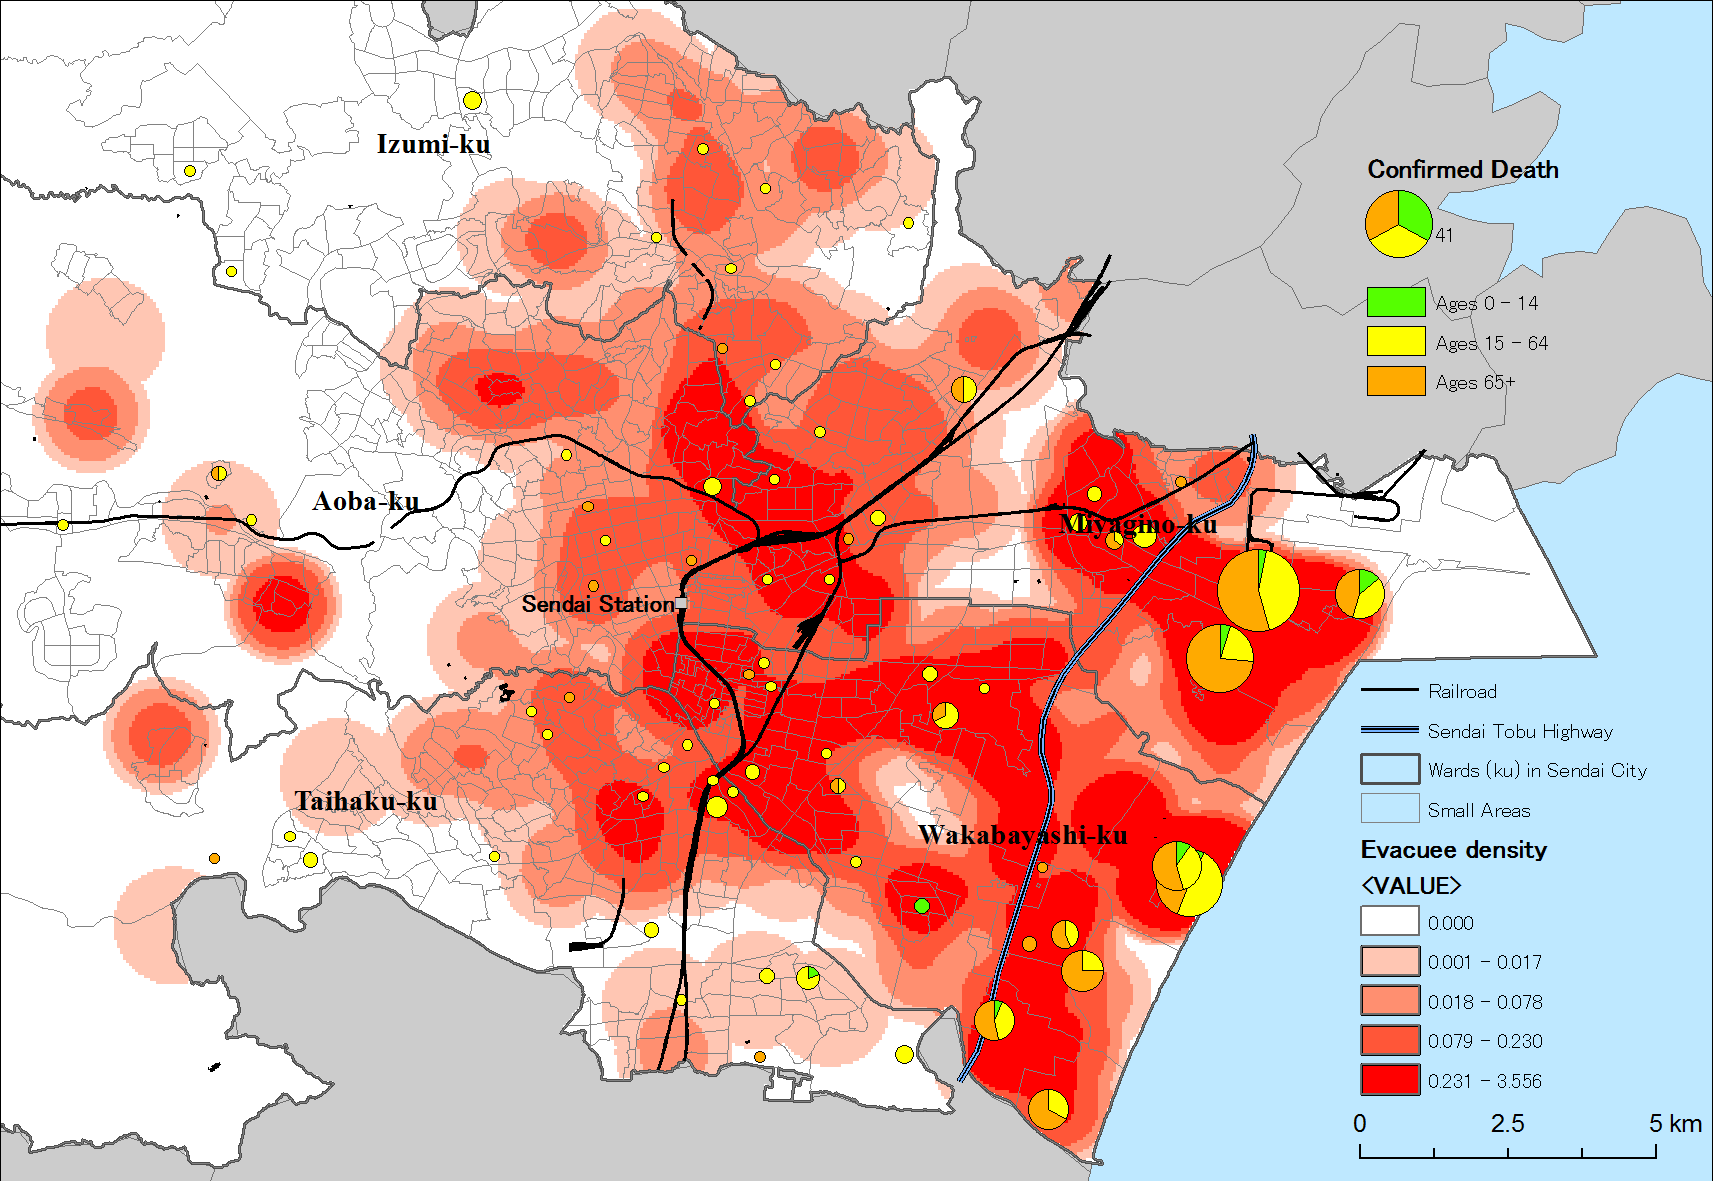
Miyagi Prefecture publicize the list of confirmed death with name, sex, age and address and the list as of 29 March contains 362 death of Sendai citizens. Since number of missing persons is not available for Sendai City, there is no way to gauge how complete the list is, but mapping the addresses of the dead will reveal the impact of the disaster on human lives. Pie charts distributed in Figure 1 does that with breakdowns by age groups. Most casualties occurred between the coast and Sendai Tobu Highway as 10 m high tsunami spread until stopped by the embankment of the highway. Deaths of aged population are pronounced in the west of Tobu Highway whereas deaths in the east are almost exclusively that of productive ages. Bearing in mind that the distribution is that of residential address, not where the death occurred, we speculate that most deaths of those living in the west of Tobu Highway occurred in coastal areas from tsunami while they were at work. And thus we reckon that very little death occurred from the earthquake itself.
Sendai City publishes the list of evacuees with name, sex, age, usual address and evacuation center. The list is gathered between 20th and 30th March from each evacuation centers, most of which are schools and public buildings. By 20 March, electricity supply was back in most places and by 30 March, water supply was back except for tsunami struck areas. So the evacuees who continued to stay in the evacuation center and are in the list are those whose houses are severely damaged or in real fear for aftershocks. Therefore, we can infer the distribution of structural damages to houses by mapping the usual addresses of the evacuees. The list contained 4,279 evacuees from Sendai City (0.4% of whole population).
Densities of evacuees in Figure 1 can be used as an indicator of densities of severely damaged houses, but because of the variation in population densities across space, the figure masks the true intensity of the impacts in each location. Therefore, 2005 Population Census Small Area Statistics is used to calculate population density to standardize the evacuee density to yield the rate of evacuees in each location (Figure 2), which then becomes an indicator of the level of structural damage.

|
|
Figure 2. Rates of evacuees at residential usual addresses, Sendai City Sources: List of Evacuees (as of 30 March), Sendai City; 2005 Population Census Small Area Statistics |
As noted before, tsunami affected coastal areas have high rate of evacuees as many houses were swept away and infrastructures severely damaged. The rate of evacuees on the west of Tobu Highway is much lower (see how the numbers are classified in the legend). However, a closer look reveals ehotspotsf of higher rate of evacuees there, indicating some locations experienced more structural damages. Most of such locations are in residential estates developed through land cut and fill, and houses on the boundaries of cut and fill and on fill are more prone to structural damage. Early report on such damage can be found in Murayama (2011).
Reference
Murayama, Y. (2011) Preliminary report on damages at landform transformed housing estates in Sendai (Sendai no chikei-kaihen-chi (takuzochi) ni okeru higai sokuho),
URL: http://www.ajg.or.jp/disaster/files/201103_sendai_kaihen.pdf
