
God's taste
victims' attributes based on the list of victims
The 2011 East Japan Earthquake Bulletin of the Tohoku Geographical Association
9 April, 2011
Yuzuru ISODA, Associate Professor, Tohoku University
Email: isoda(a)m.tohoku.ac.jp
Disproportionately more elderly and disproportionately less children and youth died of tsunami.
Iwate, Miyagi and Fukushima Prefectures make the list of confirmed victims of the 2011 East Japan Earthquake public with the victims' name, sex, age and address. The list as of 7 April contains 8,107 individuals, probably about a third of all the death, and we can use this source to examine who had been taken for sacrifice. The list has been aggregated by age, sex and municipalities; of all the deceased in the list, 48% was male and 52% was female, and 6% was children (aged 0-14), 39% was adult (aged 15-64) and 56% was elderly (aged 65 and above).
To answer the question which age and sex had been prone to die from this disaster, I standardize a proportion of victims of an attribute by that of resident population of the same attribute; calling it a disproportion of an attribute:
pi/πi
where pi is the proportion of victims having an attribute i and πi is the proportion of resident population having the same attribute. The value 1 means that an attribute's proportions are exactly the same between the victims and the population; values greater than 1 means that an attribute is overrepresented among victims; and values less than 1 means an attribute is underrepresented among victims.
To make sure that a proportion of victims of a particular attribute differ to that of the population (i.e. pi/πi≠1), the level of statistical significance is reported by calculating the usual Z score;
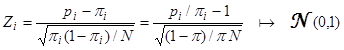 ( N is the total number of observed victims)
Our null hypothesis is that our god does not have any preferences. It should be noted however that, the sample in the list of confirmed victims can be hardly regarded as random; the body of small children might be hard find after being washed away, and male adult is more likely to be carrying a kind of identification, like driving license, which then leads to confirmation of identity.
To obtain the proportions of population having an attribute, we need to have the data when the disaster happened and fortunately, Japanese Population Census captured population on 1 October 2010. Unfortunately, the publication of the figures takes some time and is not available at the time of writing. While we wait for the census figures to appear, I estimated population age and sex as of October 2010 based on Population Census 2005 using life table and age-specific birth rates, ignoring migration. The results are tabulated by municipalities along the coast of Iwate, Miyagi and Fukushima Prefectures and shown in the form of maps in figures 1-3.

|

|

|

|
| (a) sex (female) | (b) ages 0-14 | (c) ages 15-29 | (d) ages 30-44 |
|
Figure 1. Victims' disproportions: by sex (female) and by age (15 year age bands) Sources: see text |
|||
Between the two sexes, female is overrepresented in Ishinomaki City and Iwaki City, but underrepresented in municipalities of the Sanriku ria coast (Fig 1a). Children (aged 0-14) and young adults (aged 15-29) are very much underrepresented (Fig 1b,c). The earthquake occurred at daytime and children were at schools which are very often built on safer grounds. Exception to this was the case of Okawa Elementary School in Ishinomaki City; media reports that school children gathered to the playground after the earthquake to confirm safety (that is the usual protocol) then tsunami struck and washed away most children; only 34 survived out of 108 children. Children's propensity to die has been higher in Ishinomaki City than other municipality, although still lower than average. The parenthood age group (ages 30-44) was also less prone to die, but Ministry of Health, Labour and Welfare identified 82 children lost both parents (as of 8 April) and may further increase.

|

|

|

|
| (a) male 45-59 | (b) female 45-59 | (c) male 60-74 | (d) female 60-74 |
|
Figure 2. Victims' disproportions: by sex and age, age groups 45-59 and 60-74 Sources: see text |
|||

|
|
Figure 3. Victims disproportions: by age, aged 75+ (both sex) Source: see text |
So who had been the god's favorite of all? The propensity to die from the disaster among the over 75 has been more than twice as much in most municipalities. It required to runaway for extra distance and extra height, and fast, to get away from the deadly wave of the tsunami.